🎲 Bettors Called the Blue Wave. Then Oil Cracked and $XLE Bled 📉🗳️
The bettors nailed it. Wall Street still got blindsided. At 6 p.m. ET on Election Day, prediction markets were already pricing a Democratic House as close to a lock and a Democratic Senate as a three-in-four shot. Democrats took both. So why did the day-after stock tape look nothing like a simple “risk-on, priced-in” shrug? Because the market that matters most to your portfolio wasn’t the one on Kalshi. It was oil.
What the betting markets priced
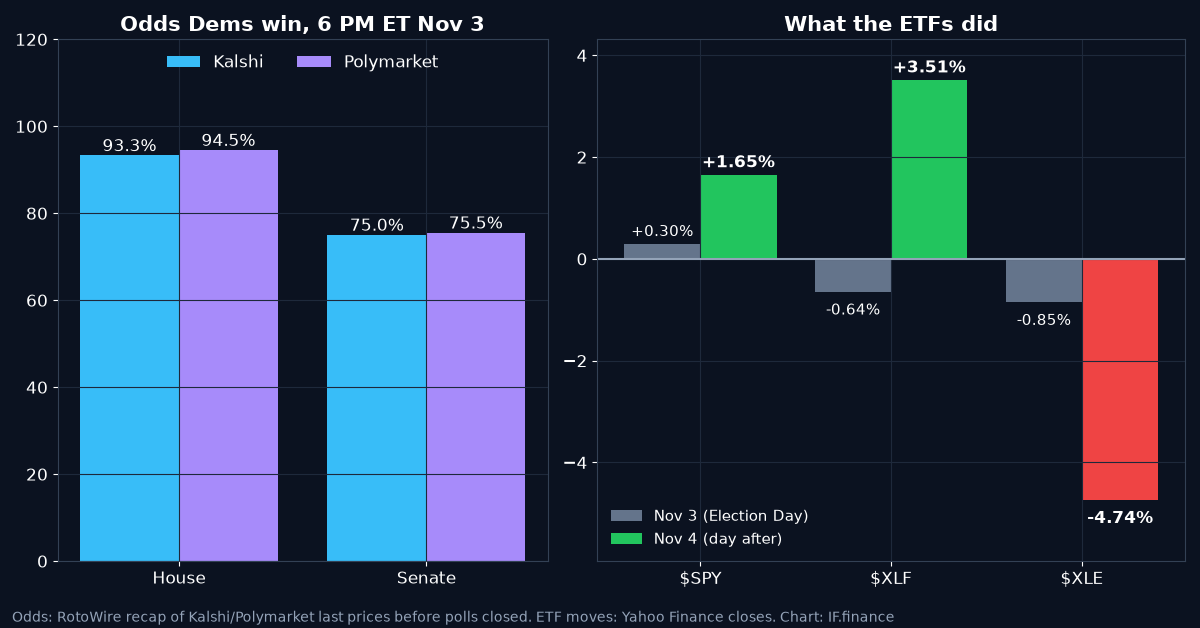
According to a RotoWire recap of the 2026 midterm markets, the last prices before the first polls closed (6 p.m. ET, Nov. 3) put the odds of Democrats winning the House at 93.3% on Kalshi and 94.5% on Polymarket. For the Senate, it was 75.0% on Kalshi and 75.5% on Polymarket, which still left about a one-in-four chance of a Republican hold.
The momentum was clear going in. Kalshi reported that the odds of a full Democratic sweep climbed from 62.4% to an all-time high of 75.6% on Election Day, then settled at 73% as of 4:50 p.m. ET. DeFi Rate’s snapshots show Kalshi’s sweep contract at 62% on Oct. 14 and 75% on the morning of Nov. 3.
This wasn’t a niche bet, either. Covers reported that Kalshi’s House-control market passed $240 million in volume a few hours after East Coast polls opened. Once real votes started coming in, both platforms moved above 99% in both chambers by about 10 p.m. ET, per RotoWire.
What actually happened
The AP reports that Democrats won control of both chambers. Reuters puts the Senate majority at at least 54-44, with Mississippi and Alaska still uncalled. For the House, NBC News estimates that Democrats will win at least 259 seats. Final seat counts are still moving as of this writing.
So on direction, the bettors were right on both calls. The Senate, priced at about 75%, was the real test, and it hit.
Election Day: stocks mostly yawned
On Tuesday, Nov. 3, with the outcome already heavily favored, the three ETFs barely moved, based on Yahoo Finance closing prices:
That’s what “priced in” looks like: a sleepy tape while a $240 million betting market does the worrying.
The day after: a blue wave, and an oil crash
Then came Wednesday, Nov. 4. Close to close:
- $SPY +1.65% (the S&P 500 index itself rose 1.58% to 7,688.62, per CNBC)
- $XLF +3.51%
- $XLE -4.74%
CNBC reported that the Dow jumped 1,569.40 points, or 3.03%, to 53,356.12. It was the Dow’s best day since April 9, 2025. The trigger CNBC pointed to was not the seat count. U.S. crude fell more than 8% after Vice President JD Vance blamed the Iran war for the party’s losses. Reuters (via Yahoo Finance) reported that Brent settled at $94.62, down nearly 9%. The 10-year Treasury yield fell 6.62 basis points to 4.88%.
A Reuters market wrap had energy as the S&P 500’s worst sector at -4.8%. It also reported that gold gained 3.5% and that Brent was down nearly 20% for the week so far.
The tension: the bettors priced the who, not the so-what
Opinion, clearly labeled: The prediction markets did their job. They put a price on who wins. But a 94% House contract can’t tell you that the vice president will blame a war the next morning, that oil traders will treat that as a peace signal, or that banks will rip 3.5% while energy bleeds almost 5%. That second-order stuff is where equity money gets made and lost.
Look at $XLF. Financials actually fell on Election Day, then jumped once the uncertainty cleared. Look at $XLE. Energy slipped on Tuesday and then got hammered on Wednesday. Neither move fits a “stocks priced the odds” story. Both fit a “stocks priced the consequences, one day late” story.
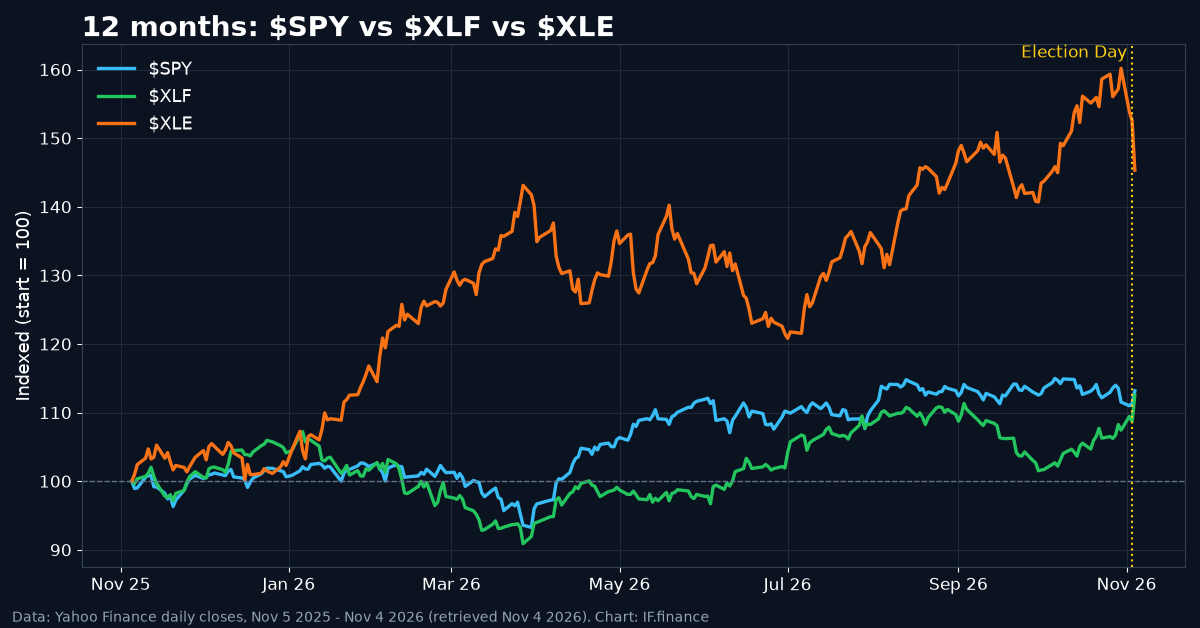
Zoom out and energy is still the 12-month champ of the three. Based on Yahoo Finance closes from Nov. 5, 2025 to Nov. 4, 2026, $XLE is up about 45%, versus roughly 13% for $SPY and 12.5% for $XLF. That’s a war-and-oil premium, and Wednesday showed how quickly the market will start pulling it back if peace looks even slightly more likely.
Does history help?
Wall Street’s favorite midterm stat is getting a workout. J.P. Morgan Asset Management notes that the S&P 500 has been higher 12 months after every midterm since 1950, with an average gain of about 15%. In a CNBC pre-election piece, a Morgan Stanley analysis found that under Republican presidents, the S&P 500 averaged 23% in the year after midterms when Congress was split, compared with 16% when Democrats controlled both chambers. This time, Democrats control both.
Opinion: Those averages are comforting, but they rest on small samples. This cycle also has a live war, oil around $95 Brent, and a 10-year yield near 4.9%. History is a tailwind, not a guarantee.
From the Proprietor
Opinion: Treat prediction markets as a weather report. They told you rain was coming, and it rained. What they don’t tell you is whose basement floods. On this election, the flooded basement was energy, and the dry one was the banks. Next time the odds hit 94% days ahead, the trade isn’t the outcome. The trade is the second-order domino nobody has priced yet.
What to watch
- Final calls in Alaska and Mississippi, and whether the Senate margin settles above 54.
- Oil: whether the Iran-war peace trade holds or reverses. $XLE will follow.
- Banks: whether $XLF can hold its new 52-week high close ($59.20 per Yahoo Finance) once the relief rally cools.
- The 10-year yield: Wednesday’s drop to 4.88% helped multiples. A rebound would test the rally.
Disclaimer: This article is for information and entertainment only and is not investment, legal, tax or betting advice. Prediction-market prices are implied probabilities, not guarantees, and may be restricted in your jurisdiction. ETF and index figures are close-to-close moves from public data and may be revised. Sections marked as opinion are the author’s views. Do your own research and consult a licensed professional before investing. The author may hold positions in securities mentioned.
Related on if.finance: AMD’s record AI quarter · Vertiv AI data-center orders · Micron after the Kioxia scare · Grok’s October stock picks.
References
- Prediction Market News: How Accurate Were the 2026 Midterm Markets? (RotoWire), accessed Nov. 4, 2026
- Midterm election odds: Democrats’ sweep odds hit 73% (Kalshi News), accessed Nov. 4, 2026
- Congress Balance of Power Odds: Kalshi vs Polymarket (DeFi Rate), accessed Nov. 4, 2026
- Most Traded Midterm Election Markets at Prediction Sites (Covers), accessed Nov. 4, 2026
- Democrats win the US House and Senate (AP News), accessed Nov. 4, 2026
- As Democrats savor big wins in Congress, Trump shows off his ballroom project (Reuters), accessed Nov. 4, 2026
- Election results 2026 live updates (NBC News), accessed Nov. 4, 2026
- Stock market news for Nov. 4, 2026 (CNBC), accessed Nov. 4, 2026
- World shares advance as Democrats’ victory eases political uncertainty (Reuters via Yahoo Finance), accessed Nov. 4, 2026
- Trading Day: Oil tanks, stocks leap on US midterms (Reuters via Investing.com), accessed Nov. 4, 2026
- What does a Democratic Congress mean for markets? (J.P. Morgan Asset Management), accessed Nov. 4, 2026
- What the midterms mean for defense, healthcare, crypto and AI stocks (CNBC), accessed Nov. 4, 2026
- $SPY, $XLF, $XLE historical prices (Yahoo Finance), retrieved Nov. 4, 2026 at about 7:30 p.m. CT
Image credits
- Featured image and both charts: created by IF.finance with Python/matplotlib from public data (Yahoo Finance prices; Kalshi and Polymarket odds as reported by RotoWire). No AI-generated imagery.