🌊 Blue Wave Policy Bets: Chips Sink, Oil Bleeds, Hospitals Soar 💊⚡

The blue wave pushed the S&P 500 to its best day in three months, and it still left a trail of red tickers behind it. On Wednesday, Nov. 4, the day after Democrats took both the House and the Senate, investors repriced three big policy bets in a single session: tariffs and AI hardware, energy and permitting, and drug pricing. The scoreboard is not what most people expected.
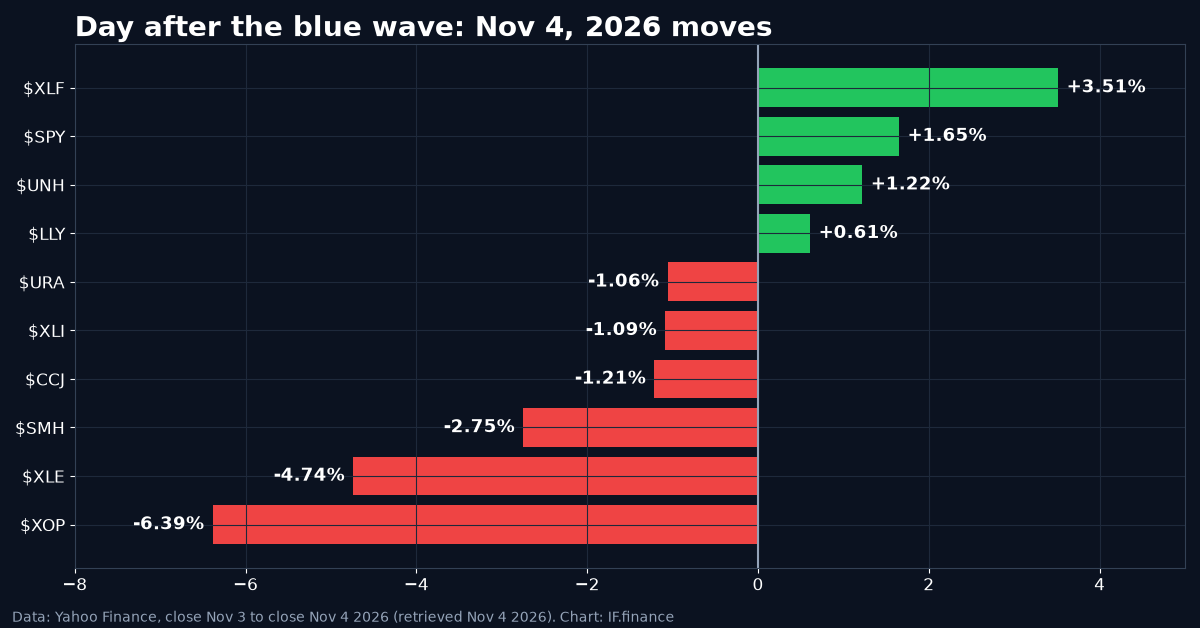
Horizontal bar chart of Nov 4, 2026 moves: XLF, SPY, UNH, LLY up; URA, XLI, CCJ, SMH, XLE, XOP down
Close-to-close moves, Nov. 3 to Nov. 4, 2026. Data: Yahoo Finance. Chart: IF.finance.

For context, Yahoo Finance closes show $SPY up 1.65% on the day. $XLF (financials) gained 3.51% and closed at a new 52-week high. Now for the policy bets.

Bet #1: Tariffs and China, so sell the chips? Not quite

The easy story is that a Democratic Congress means a fight over tariffs, and that this hits semis and industrials. The real picture is messier.

According to J.P. Morgan Asset Management, the effective U.S. tariff rate has already fallen to about 10.6%, down from roughly 30% after “Liberation Day.” J.P. Morgan says the Supreme Court struck down the emergency-power tariffs in February, and the administration has since leaned on Section 301. It also says a Democratic Congress “will be limited in its ability to lower tariffs on its own,” and that overriding a veto would take about a dozen Republican senators. In other words, the President still holds the tariff pen.

So why did chips drop? $SMH fell 2.75%, and Investor’s Business Daily reported that the Philadelphia Semiconductor Index fell 3.1%, after sliding as much as 5.1%, to its lowest level since late April. The pressure came from data centers, not trade. CNBC noted that Texas’s Democratic governor-elect has promised a data center moratorium. It also reported that Micron fell 7%, CoreWeave slid 9.9%, and Vistra lost 13.8%. Quartz, citing a Wells Fargo estimate, said Texas holds 27% of planned U.S. data center gigawatts.

Industrials were split. $XLI slipped 1.09%, and defense names took the hardest hit. CNBC reported Lockheed Martin -6.9%, Northrop Grumman -4.5% and RTX -2.4%. Airlines rallied 6% to 8% on the “affordability trade.”

Opinion: The tariff trade is a head fake. Congress can hold hearings, but it can’t easily take the tariff pen away. The real political risk to the chip trade is the local fight over data centers: power bills, water and zoning. Watch the state houses, not just Capitol Hill.

Bet #2: Energy permitting, oil and uranium

This is where the tape got violent. $XLE fell 4.74%, and the exploration-and-production ETF $XOP fell 6.39%. But permitting wasn’t the main driver. Reuters (via Yahoo Finance) reported that Brent fell nearly 9% to settle at $94.62 a barrel, after President Trump acknowledged that the Iran war had played a role in his party’s defeat. In a separate Reuters wrap, Brent was down nearly 20% for the week so far.

On permitting itself, J.P. Morgan says bipartisan permitting reform “could help by accelerating new power generation and transmission.” It also warns that local moratoriums and tougher permitting rules could delay data center projects and raise their costs. Clean energy was the clear winner on the day. CNBC reported gains of 4.6% for First Solar and 4.9% for NextEra Energy.

Uranium didn’t get a blue-wave bounce. $URA slipped 1.06%, and Cameco ($CCJ) fell 1.21% on the day it held its third-quarter call. A Zacks recap of the call said Cameco narrowed its 2026 production guidance to 19.5 to 20.5 million pounds. Meanwhile, Crux Investor, citing TradeTech, reported that the long-term uranium contract price hit a record $99 per pound on Oct. 31.

Opinion: Uranium is the oddest chart in this group. The commodity is at a record, and the miners are falling. If data center power demand slows, as the market traded on Wednesday, the nuclear-for-AI premium shrinks with it, even though reactors still need fuel.

Bet #3: Drug pricing, with $LLY and $UNH

You’d expect a Democratic sweep to hit pharma and managed care. It didn’t. Eli Lilly ($LLY) rose 0.61%, and UnitedHealth Group ($UNH) gained 1.22%. Hospitals went much further. CNBC reported that HCA Healthcare rose 10.3% and Centene 12.6%. Not every healthcare name rallied, though: the Reuters wrap had CVS down 12.5%.

Why the calm in pharma? A Trefis analysis argues that the toughest pricing moves already came from a Republican White House. It says drugmakers that signed price deals are exempt from a 100% tariff on patented drugs through January 2029. It also says Medicare pays $245 a month for Zepbound and Wegovy under the Lilly and Novo deals, while patients pay $50, through a pilot that ends in December 2027. A lasting benefit would need Congress, which makes it upside for Lilly rather than risk. Trefis also flags Nov. 30, 2026 as the deadline for Medicare’s next round of negotiated prices, and says Lilly’s Trulicity is on that list.

The real fight could land on insurers and on the deals themselves. KFF Health News reports that Democrats plan to investigate the undisclosed drug-pricing deals tied to tariff relief. They also plan to push to reverse cuts to the ACA and Medicaid. KFF also notes that limits on pharmacy benefit managers have support from both parties.

Opinion: For $UNH, more Medicaid and ACA money is a tailwind, but PBM reform is the knife. For $LLY, the obesity-coverage pilot could turn into the best bipartisan deal of 2027, or a hostage in the next budget fight.
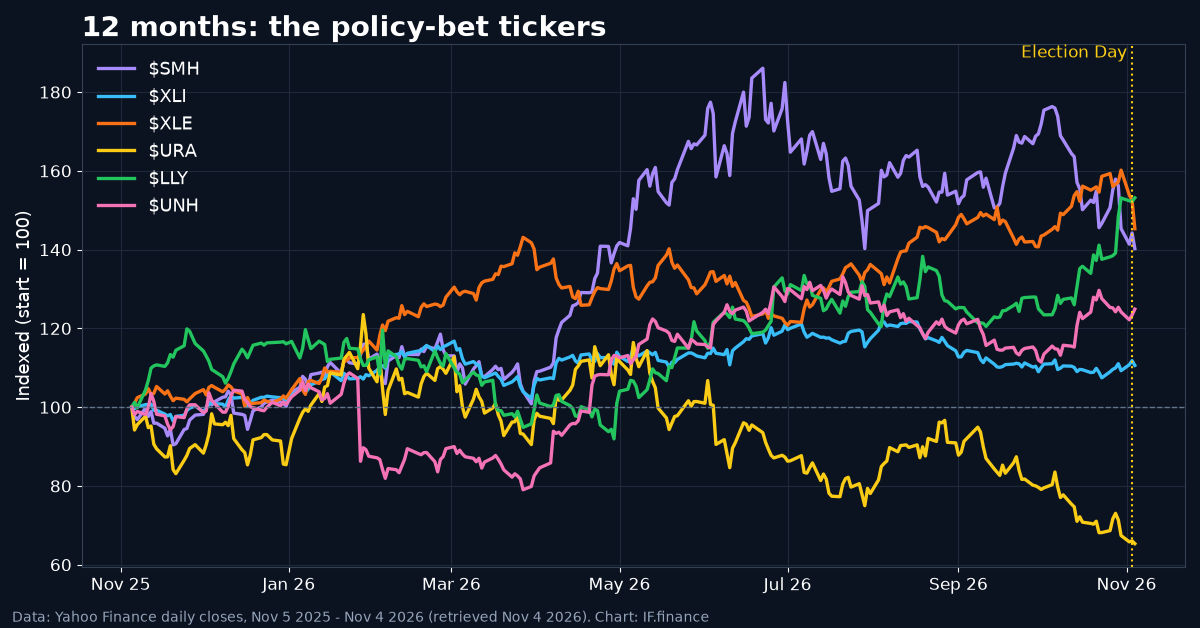
12-month indexed chart of SMH, XLI, XLE, URA, LLY and UNH through Nov 4, 2026
12-month performance, indexed to 100, through Nov. 4, 2026. Data: Yahoo Finance. Chart: IF.finance.

From the Proprietor

Opinion: Everyone set up for the textbook trade: Democrats win, so sell pharma, buy green, fight tariffs. The tape had other ideas. Pharma shrugged, insurers rose, chips sank on data center politics, and oil got crushed by a war narrative. The lesson is to stop trading the party label and trade the specific lever each party can actually pull. In this Congress, that means subpoenas, budgets and permitting, not tariffs.

What to watch

  • Nov. 30, 2026: Medicare’s next list of negotiated drug prices (per Trefis), including Lilly’s Trulicity.
  • Texas data center policy under the incoming governor: watch $SMH and power names.
  • Iran-war diplomacy and oil: $XLE and $XOP are trading on peace odds now.
  • Any bipartisan permitting bill: watch $URA, $CCJ and the utilities.
  • Uncalled Senate races in Alaska and Mississippi (per Reuters and NBC News).

Disclaimer: This article is for information and entertainment only and is not investment, legal or tax advice. Price moves are close-to-close figures from public data and may be revised. Policy outcomes are uncertain, and nothing here predicts what Congress or the White House will enact. Sections marked as opinion are the author’s views. Do your own research and consult a licensed professional before investing. The author may hold positions in securities mentioned.

Related on if.finance: Micron vs. memory peers · AMD AI earnings · Vertiv orders · Energy Fuels / uranium · Grok stock picks.

References

  1. What does a Democratic Congress mean for markets? (J.P. Morgan Asset Management), accessed Nov. 4, 2026
  2. Every stock that moved because of the election (CNBC), accessed Nov. 4, 2026
  3. Chip Stocks Feeling Blue After Democratic Party Victories (Investor’s Business Daily), accessed Nov. 4, 2026
  4. Chip stocks slip as Democrats’ sweep clouds data center outlook (Quartz), accessed Nov. 4, 2026
  5. World shares advance as Democrats’ victory eases political uncertainty (Reuters via Yahoo Finance), accessed Nov. 4, 2026
  6. Trading Day: Oil tanks, stocks leap on US midterms (Reuters via Investing.com), accessed Nov. 4, 2026
  7. Cameco Q3 Earnings Call Highlights Uranium Pricing Discipline (Zacks via Yahoo Finance), accessed Nov. 4, 2026
  8. Record US$99 Uranium Contract Price Favors Miners Yet to Sell 2030s Output (Crux Investor), accessed Nov. 4, 2026
  9. Lilly Stock Near A High: What Can Democrats Change? (Trefis), accessed Nov. 4, 2026
  10. Democrats’ Election Rout Is Poised To Dramatically Reorder Federal Health Policy (KFF Health News), accessed Nov. 4, 2026
  11. Democrats win the US House and Senate (AP News), accessed Nov. 4, 2026
  12. Yahoo Finance historical prices ($SPY, $XLF, $SMH, $XLI, $XLE, $XOP, $URA, $CCJ, $LLY, $UNH), retrieved Nov. 4, 2026 at about 7:30 p.m. CT

Image credits

  • Featured image and both charts: created by IF.finance with Python/matplotlib from Yahoo Finance price data. No AI-generated imagery and no third-party logos.

🎲 Bettors Called the Blue Wave. Then Oil Cracked and $XLE Bled 📉🗳️

The bettors nailed it. Wall Street still got blindsided. At 6 p.m. ET on Election Day, prediction markets were already pricing a Democratic House as close to a lock and a Democratic Senate as a three-in-four shot. Democrats took both. So why did the day-after stock tape look nothing like a simple “risk-on, priced-in” shrug? Because the market that matters most to your portfolio wasn’t the one on Kalshi. It was oil.

What the betting markets priced

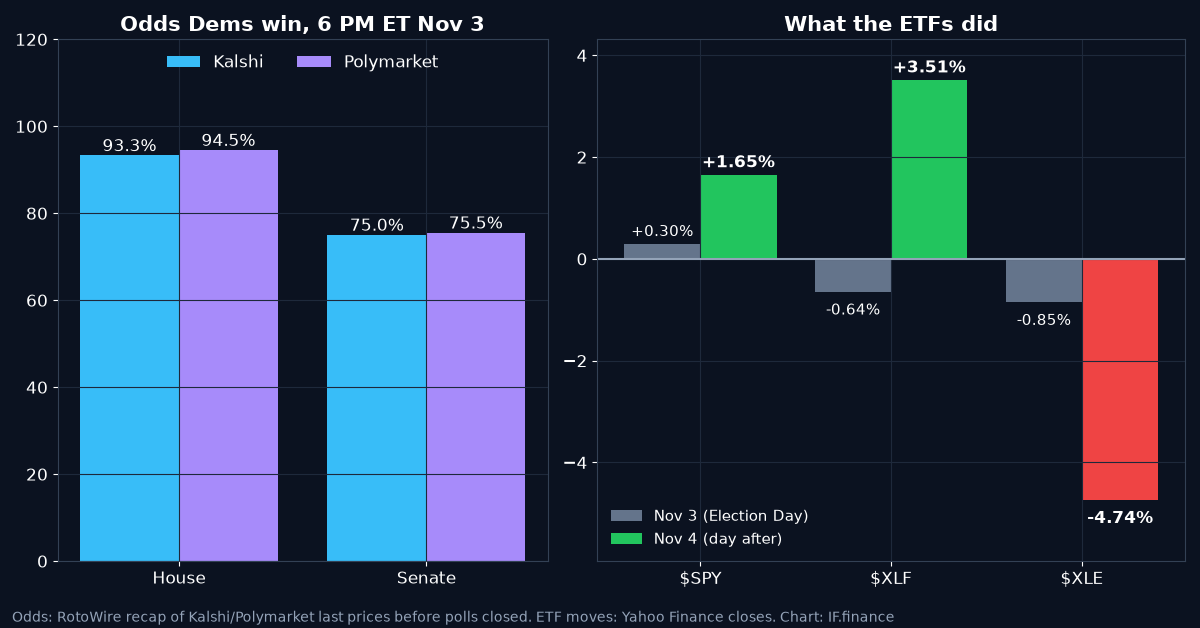
According to a RotoWire recap of the 2026 midterm markets, the last prices before the first polls closed (6 p.m. ET, Nov. 3) put the odds of Democrats winning the House at 93.3% on Kalshi and 94.5% on Polymarket. For the Senate, it was 75.0% on Kalshi and 75.5% on Polymarket, which still left about a one-in-four chance of a Republican hold.

The momentum was clear going in. Kalshi reported that the odds of a full Democratic sweep climbed from 62.4% to an all-time high of 75.6% on Election Day, then settled at 73% as of 4:50 p.m. ET. DeFi Rate’s snapshots show Kalshi’s sweep contract at 62% on Oct. 14 and 75% on the morning of Nov. 3.

This wasn’t a niche bet, either. Covers reported that Kalshi’s House-control market passed $240 million in volume a few hours after East Coast polls opened. Once real votes started coming in, both platforms moved above 99% in both chambers by about 10 p.m. ET, per RotoWire.

Bar chart: Kalshi and Polymarket odds of Democrats winning the House and Senate at 6 PM ET Nov 3, next to daily moves in SPY, XLF and XLE on Nov 3 and Nov 4, 2026
Left: last odds before polls closed (RotoWire recap of Kalshi and Polymarket). Right: daily close-to-close moves (Yahoo Finance). Chart: IF.finance.

What actually happened

The AP reports that Democrats won control of both chambers. Reuters puts the Senate majority at at least 54-44, with Mississippi and Alaska still uncalled. For the House, NBC News estimates that Democrats will win at least 259 seats. Final seat counts are still moving as of this writing.
So on direction, the bettors were right on both calls. The Senate, priced at about 75%, was the real test, and it hit.

Election Day: stocks mostly yawned

On Tuesday, Nov. 3, with the outcome already heavily favored, the three ETFs barely moved, based on Yahoo Finance closing prices:

  • $SPY (S&P 500): +0.30%
  • $XLF (financials): -0.64%
  • $XLE (energy): -0.85%

That’s what “priced in” looks like: a sleepy tape while a $240 million betting market does the worrying.

The day after: a blue wave, and an oil crash

Then came Wednesday, Nov. 4. Close to close:

  • $SPY +1.65% (the S&P 500 index itself rose 1.58% to 7,688.62, per CNBC)
  • $XLF +3.51%
  • $XLE -4.74%

CNBC reported that the Dow jumped 1,569.40 points, or 3.03%, to 53,356.12. It was the Dow’s best day since April 9, 2025. The trigger CNBC pointed to was not the seat count. U.S. crude fell more than 8% after Vice President JD Vance blamed the Iran war for the party’s losses. Reuters (via Yahoo Finance) reported that Brent settled at $94.62, down nearly 9%. The 10-year Treasury yield fell 6.62 basis points to 4.88%.

A Reuters market wrap had energy as the S&P 500’s worst sector at -4.8%. It also reported that gold gained 3.5% and that Brent was down nearly 20% for the week so far.

The tension: the bettors priced the who, not the so-what

Opinion, clearly labeled: The prediction markets did their job. They put a price on who wins. But a 94% House contract can’t tell you that the vice president will blame a war the next morning, that oil traders will treat that as a peace signal, or that banks will rip 3.5% while energy bleeds almost 5%. That second-order stuff is where equity money gets made and lost.

Look at $XLF. Financials actually fell on Election Day, then jumped once the uncertainty cleared. Look at $XLE. Energy slipped on Tuesday and then got hammered on Wednesday. Neither move fits a “stocks priced the odds” story. Both fit a “stocks priced the consequences, one day late” story.

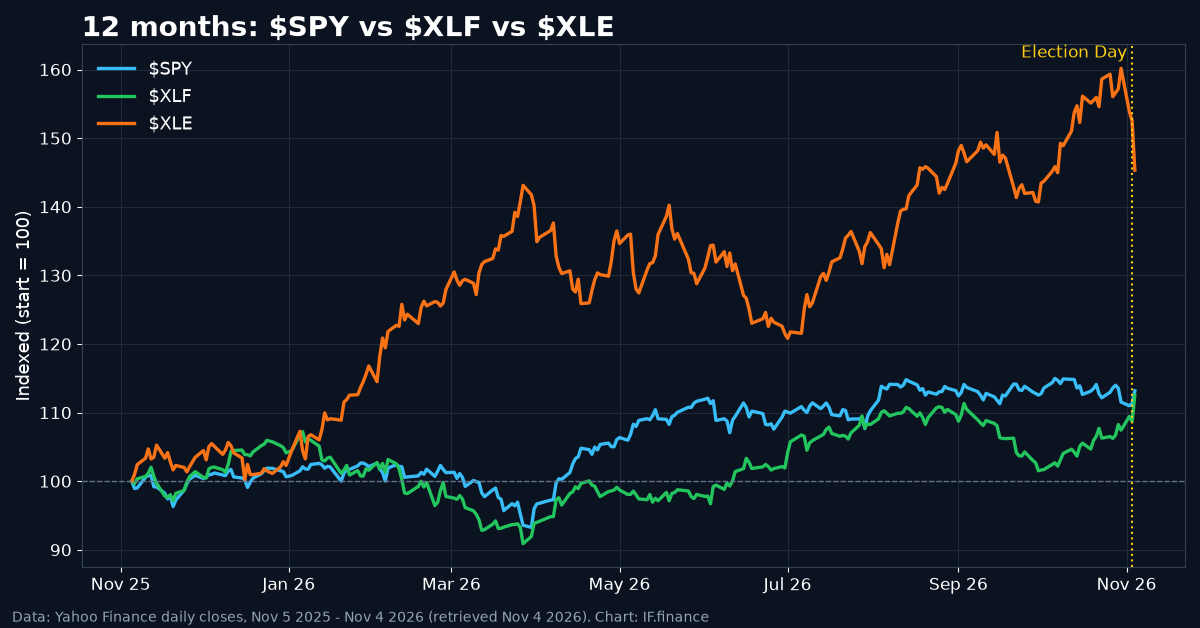
12-month indexed chart of SPY, XLF and XLE through Nov 4, 2026
12-month performance, indexed to 100, through Nov. 4, 2026. Data: Yahoo Finance. Chart: IF.finance.

Zoom out and energy is still the 12-month champ of the three. Based on Yahoo Finance closes from Nov. 5, 2025 to Nov. 4, 2026, $XLE is up about 45%, versus roughly 13% for $SPY and 12.5% for $XLF. That’s a war-and-oil premium, and Wednesday showed how quickly the market will start pulling it back if peace looks even slightly more likely.

Does history help?

Wall Street’s favorite midterm stat is getting a workout. J.P. Morgan Asset Management notes that the S&P 500 has been higher 12 months after every midterm since 1950, with an average gain of about 15%. In a CNBC pre-election piece, a Morgan Stanley analysis found that under Republican presidents, the S&P 500 averaged 23% in the year after midterms when Congress was split, compared with 16% when Democrats controlled both chambers. This time, Democrats control both.

Opinion: Those averages are comforting, but they rest on small samples. This cycle also has a live war, oil around $95 Brent, and a 10-year yield near 4.9%. History is a tailwind, not a guarantee.

From the Proprietor

Opinion: Treat prediction markets as a weather report. They told you rain was coming, and it rained. What they don’t tell you is whose basement floods. On this election, the flooded basement was energy, and the dry one was the banks. Next time the odds hit 94% days ahead, the trade isn’t the outcome. The trade is the second-order domino nobody has priced yet.

What to watch

  • Final calls in Alaska and Mississippi, and whether the Senate margin settles above 54.
  • Oil: whether the Iran-war peace trade holds or reverses. $XLE will follow.
  • Banks: whether $XLF can hold its new 52-week high close ($59.20 per Yahoo Finance) once the relief rally cools.
  • The 10-year yield: Wednesday’s drop to 4.88% helped multiples. A rebound would test the rally.

Disclaimer: This article is for information and entertainment only and is not investment, legal, tax or betting advice. Prediction-market prices are implied probabilities, not guarantees, and may be restricted in your jurisdiction. ETF and index figures are close-to-close moves from public data and may be revised. Sections marked as opinion are the author’s views. Do your own research and consult a licensed professional before investing. The author may hold positions in securities mentioned.

Related on if.finance: AMD’s record AI quarter · Vertiv AI data-center orders · Micron after the Kioxia scare · Grok’s October stock picks.

References

  1. Prediction Market News: How Accurate Were the 2026 Midterm Markets? (RotoWire), accessed Nov. 4, 2026
  2. Midterm election odds: Democrats’ sweep odds hit 73% (Kalshi News), accessed Nov. 4, 2026
  3. Congress Balance of Power Odds: Kalshi vs Polymarket (DeFi Rate), accessed Nov. 4, 2026
  4. Most Traded Midterm Election Markets at Prediction Sites (Covers), accessed Nov. 4, 2026
  5. Democrats win the US House and Senate (AP News), accessed Nov. 4, 2026
  6. As Democrats savor big wins in Congress, Trump shows off his ballroom project (Reuters), accessed Nov. 4, 2026
  7. Election results 2026 live updates (NBC News), accessed Nov. 4, 2026
  8. Stock market news for Nov. 4, 2026 (CNBC), accessed Nov. 4, 2026
  9. World shares advance as Democrats’ victory eases political uncertainty (Reuters via Yahoo Finance), accessed Nov. 4, 2026
  10. Trading Day: Oil tanks, stocks leap on US midterms (Reuters via Investing.com), accessed Nov. 4, 2026
  11. What does a Democratic Congress mean for markets? (J.P. Morgan Asset Management), accessed Nov. 4, 2026
  12. What the midterms mean for defense, healthcare, crypto and AI stocks (CNBC), accessed Nov. 4, 2026
  13. $SPY, $XLF, $XLE historical prices (Yahoo Finance), retrieved Nov. 4, 2026 at about 7:30 p.m. CT

Image credits

  • Featured image and both charts: created by IF.finance with Python/matplotlib from public data (Yahoo Finance prices; Kalshi and Polymarket odds as reported by RotoWire). No AI-generated imagery.

Micron ($MU) Gets Mugged by Kioxia’s Warning: Is Wall Street Dumping the Wrong Memory Stock?

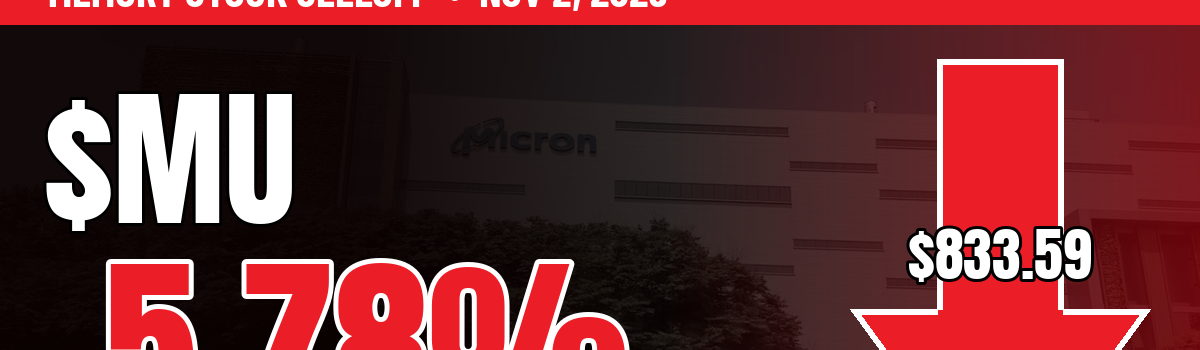
Micron just posted the biggest quarter in its history, with $54.23 billion in revenue. On November 2 the market knocked $51.15 off the stock in a single session anyway. The trigger wasn’t Micron at all. It was a cautious outlook from Japanese flash maker Kioxia. Our take: traders lumped a DRAM-and-HBM powerhouse in with its NAND-heavy peers, and mid-December earnings are where that bet gets settled.

Micron stock story: exterior view of a Micron fabrication plant in Taichung, Taiwan
Micron fab in Taichung, Taiwan, November 2023. Photo: Thingreenline4546 via Wikimedia Commons, CC BY-SA 4.0 (cropped).

Micron Technology ($MU) has spent 2026 as one of the loudest public bets on AI memory. Then a rival blinked. Kioxia guided December-quarter operating profit only slightly above the prior quarter and below estimates, and U.S. memory names sold off in sympathy. Micron closed at $833.59, down 5.78% from an $884.74 prior close, according to Yahoo Finance. After-hours trading then bounced toward about $853. That bounce suggests at least some buyers thought the market had overreacted. [4][5]

Micron Technology company logo, dark wordmark on light background
Micron logo. Source: micron.com press image gallery via Wikimedia Commons (PD-textlogo). Trademark of Micron Technology, Inc., used for identification only.

Micron is one of the AI and Super Intelligence names on Grok’s October stock-picks list. Whether Monday hurt isn’t the question. It did. The real question is whether a NAND specialist’s soft guide tells you anything lasting about a company whose profit engine is DRAM and high-bandwidth memory (HBM). Our view: mostly no. The stock still has to prove it in December.

A record quarter the market seems to have forgotten

Start with the numbers from Micron’s own release. For the fiscal fourth quarter ended September 3, 2026, revenue was $54.23 billion, up from $41.46 billion the prior quarter and $11.32 billion a year earlier. GAAP net income was $37.70 billion, or $32.87 per diluted share. Non-GAAP EPS was $33.42. [1]

For the full fiscal year, revenue reached $133.19 billion, up from $37.38 billion. Non-GAAP net income was $86.76 billion. Cash, marketable investments and restricted cash ended the year at $73.48 billion, and adjusted free cash flow was $62.31 billion for the year after $27.37 billion of net capital spending. [1]

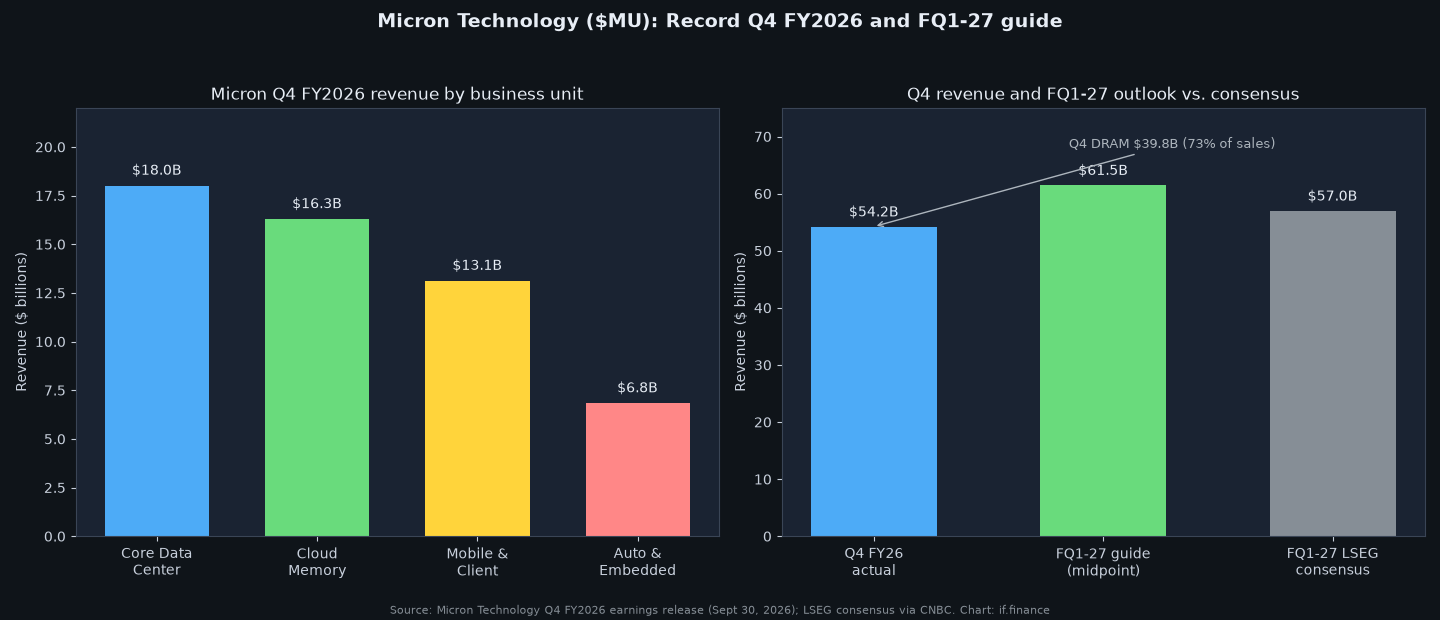
CNBC, citing LSEG, said the $33.42 adjusted EPS beat a $31.61 consensus and revenue beat a $51.07 billion estimate. Then management raised the bar. Micron guided fiscal Q1 2027 revenue to $61.5 billion ± $1.5 billion, with non-GAAP gross margin of about 86.25% and EPS of $38.15 ± $1.00. That compares with the roughly $57 billion and $35.40 LSEG expectations CNBC cited. [1][2]

CEO Sanjay Mehrotra didn’t sound like someone bracing for a downturn: “AI is becoming Super Intelligence (SI), and memory enhances this intelligence and the competitiveness of our customers’ platforms… our Strategic Customer Agreements provide added confidence in the durability of Micron’s financial performance.” [1]

Our take: a company guiding the next quarter about $4.5 billion above consensus is planting a flag. A one-day selloff driven by somebody else’s guidance doesn’t erase that.

Kioxia sneezed. Does Micron really catch the cold?

Kioxia’s November 2 update was the spark. 24/7 Wall St. reported that Kioxia guided December-quarter operating profit to ¥2 trillion, barely above about ¥1.99 trillion in the September quarter and below estimates. CFO Yoshihiko Kawamura called it shipment timing, with some orders pulled into September and others pushed into March. He also said AI data-center demand stays robust, that next year’s planned output is already sold out, and that rapid growth should return in the March quarter. [4]

Read that again: even the company that triggered the selloff called it a timing issue, not a demand problem. Western Digital and SanDisk, which are far more tied to flash, fell about 5% and 3% intraday in the 24/7 account. That makes sense. Micron is a different animal. Its prepared remarks put fiscal Q4 DRAM revenue at a record $39.8 billion, up 343% year over year and 73% of total sales. NAND was $14.1 billion, about 26%. [3][4]

HBM sits inside that DRAM engine. CNBC noted that Micron is the only U.S.-based HBM maker and is working with Nvidia on a custom HBM implementation. The prepared remarks say HBM revenue grew faster than total revenue in Q4 and that the vast majority of calendar 2027 HBM bit supply is already agreed, with significant year-over-year price increases. They add that Micron is ramping HBM4 while collaborating with NVIDIA on NVHBM (custom HBM4E). [2][3]

Business-unit sales show where the money went. Core Data Center brought in $18.002 billion, Cloud Memory $16.283 billion, Mobile and Client $13.114 billion, and Automotive and Embedded $6.824 billion. [1]

Two charts: Micron Q4 FY2026 revenue by business unit, and Q4 actual plus FQ1-27 guide midpoint versus LSEG consensus
Left: Q4 FY2026 business-unit revenue. Right: Q4 revenue and FQ1-27 guide midpoint vs. LSEG consensus (via CNBC). Sources: Micron Q4 FY2026 earnings release; LSEG via CNBC. Chart: if.finance.

Our take: selling a 73%-DRAM company because a flash maker shifted shipments between quarters looks like reflex, not analysis. That doesn’t make the drop irrational. It means the market is trading the memory group rather than the business mix.

The bull case: scarcity, contracts and cash

Management’s pitch is scarcity, not a soft landing. According to 24/7 Wall St.’s recap of the September 30 earnings call, President and COO Manish Bhatia said Micron does not have “line of sight to when supply and demand balance,” and more than 75% of shipments were already committed for the year. [4]

The prepared remarks back that up with contracts. Micron has 26 strategic customer agreements, estimated at more than 35% of revenue through 2030. Remaining performance obligations are about $150 billion on contracts with set pricing frameworks, and customer financial commitments total $32 billion, mostly cash deposits. [3] Customers don’t usually wire deposits for a product they expect to be cheap next year.

The bear case you can’t wave away

Here’s the tension. Monday’s drop didn’t start from a calm base. 24/7 Wall St. put $MU roughly 20% lower over the prior month even after the record print. Yahoo Finance’s one-month figure around the November 2 close was about −22%, while the year-to-date return was still about +192%. [4][5] You can track the live tape on our chart page.

A stock that has nearly tripled this year doesn’t need a disaster to fall. It just needs doubt. If AI memory pricing rolls over, or hyperscalers stretch out HBM and high-capacity DRAM purchases, a name priced for scarcity can reprice fast. Yahoo Finance showed an average analyst price target near $1,562 as of the November 2 quote page. That is a very bullish Street view, and it assumes the cycle holds. [5] Capex is another swing factor: CNBC reported about $250 billion for Micron’s planned U.S. campuses in Clay, New York, and Boise. [2]

Our take: the bears aren’t wrong that memory is cyclical. They are early to assume this cycle ends on a competitor’s shipment timing.

What to watch next

  • Mid-December earnings. Fiscal Q1 2027 results are expected in mid-December. Micron hasn’t confirmed the date on its IR site yet. Delivering on the $61.5 billion ± $1.5 billion guide is the whole ballgame. [1]
  • DRAM vs. NAND pricing. Kioxia’s commentary is a NAND signal. Watch whether Micron’s DRAM and HBM pricing keeps climbing. [3][4]
  • HBM4 / NVHBM execution. Watch for confirmation that calendar 2027 HBM supply stays contracted and that the Nvidia custom path stays on track. [3]
  • Capex and U.S. fabs. Watch delivery timelines on the U.S. campus builds (about $250 billion for Clay and Boise, per CNBC). [2]
  • More AI memory coverage in our AI and Super Intelligence section.

The bottom line (opinion): Wall Street just sold Micron for a rival’s timing problem. If the December print lands near guidance, Monday will look like a gift. If it doesn’t, the bears will have been early rather than wrong. Either way, the fight is over Micron’s own numbers, not Kioxia’s.

This article is for information only and is not investment advice. Sections marked “Our take,” “Our view” or “opinion” are if.finance analysis and opinion. Figures are from company filings and the reporting cited below as of November 3, 2026.

References

  1. Micron Technology, Inc. Reports Record Fiscal Fourth-Quarter and Full-Year 2026 Results, Micron Technology, Inc. (press release / GlobeNewswire), September 30, 2026.
  2. Micron beats on earnings and issues strong guidance as data center revenue jumps 11-fold, CNBC (Katie Tarasov, Kif Leswing), September 30, 2026 (updated October 1, 2026).
  3. Q4 FY26 Prepared Remarks, Micron Technology, Inc., September 30, 2026.
  4. Micron Falls 4% as Kioxia’s Cautious Outlook Hits Memory Stocks; Western Digital Drops 5%, SanDisk Slides 3%, 24/7 Wall St. (David Moadel), November 2, 2026.
  5. Micron Technology, Inc. (MU) quote and performance, Yahoo Finance, as of close November 2, 2026.

Image credits

  • Featured graphic: made by if.finance using “Micron Fab in Taichung, Taiwan” by Thingreenline4546 (Wikimedia Commons, CC BY-SA 4.0). The photo was cropped and darkened, with text and figures added; the graphic is shared under CC BY-SA 4.0. The figures come from the Yahoo Finance quote and Micron’s Q4 FY2026 release.
  • Featured photo (in article): “Micron Fab in Taichung, Taiwan” by Thingreenline4546, Wikimedia Commons, licensed CC BY-SA 4.0. Cropped to 1200×628 by if.finance.
  • Micron logo: from Micron’s press image gallery via Wikimedia Commons (PD-textlogo). Trademark of Micron Technology, Inc., shown for identification only.
  • Chart: made by if.finance from Micron’s Q4 FY2026 earnings release and LSEG consensus as reported by CNBC.
Read More

Vertiv ($VRT) Just Doubled Its Orders. So Why Is the Stock Still Nearly 40% Off Its High?

Organic orders more than doubled. Sales jumped 61% to $4.3 billion. Full-year guidance went up by $650 million. And even after a 14% one-day pop, the stock was still nearly 40% below its May record. Our take: Vertiv is the AI trade’s plumber, the market still hasn’t settled on what that’s worth, and the next leg depends on whether orders stay this hot.

Rows of server racks inside a data center, the kind of facility that drives Vertiv earnings from power and cooling gear
Server racks in a data center. Photo: Carl Lender via Wikimedia Commons, CC BY 2.0 (cropped).

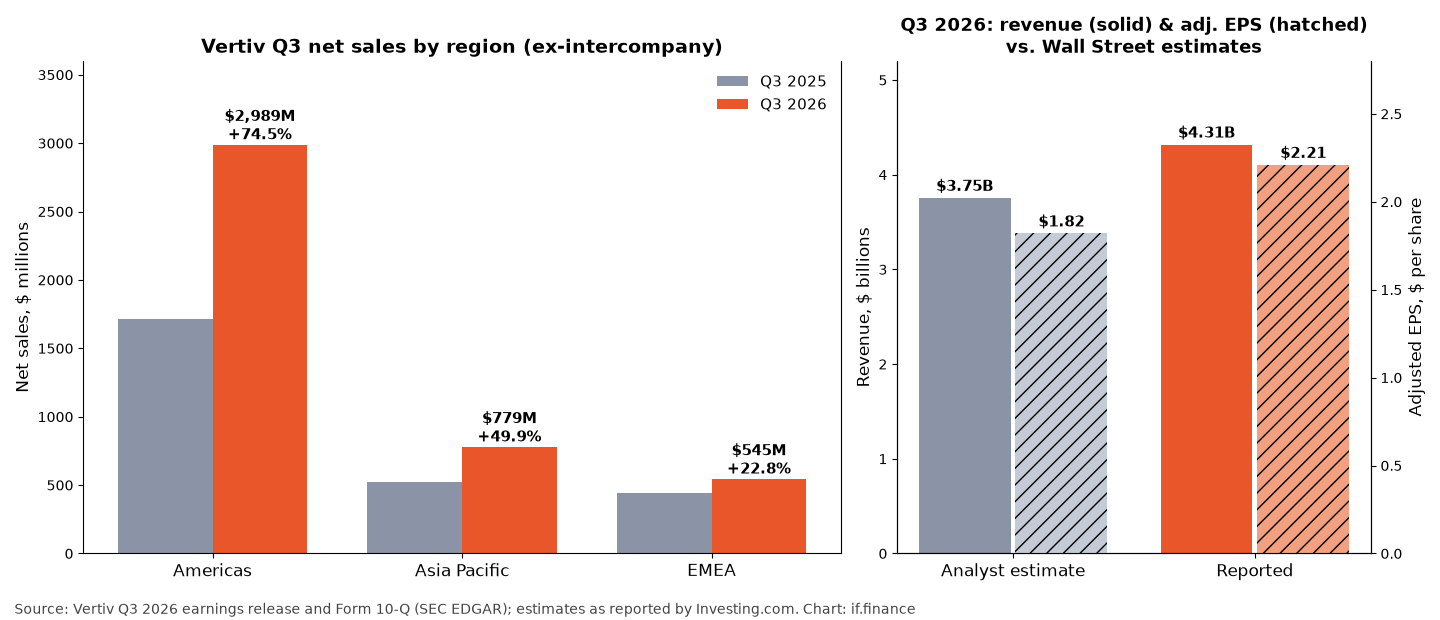
Vertiv Holdings Co ($VRT) doesn’t make the AI chips that grab the headlines. It makes the things those chips can’t run without: power systems, liquid and air cooling, racks, and the service crews behind them. Unglamorous? Sure. But when Vertiv reported third-quarter results on October 28, it showed that the picks-and-shovels side of AI is growing faster than almost anyone on Wall Street expected. Net sales rose 61% from a year earlier to $4.313 billion, and organic orders (excluding acquisitions and currency moves) grew more than 100%. [1]

Vertiv company logo, dark gray wordmark with orange accent
Vertiv logo. Source: vertiv.com. Trademark of Vertiv Holdings Co, used for identification only.

Vertiv is one of the AI-infrastructure names on Grok’s October stock-picks list. Our view: this quarter was the clearest evidence yet that the AI build-out is still speeding up where it physically counts. Here’s what the numbers say and where the trap could be.

A blowout on every line

GAAP diluted earnings per share jumped 91% to $1.95. Adjusted EPS, which strips out items such as acquisition-related amortization, rose 78% to $2.21. Net income nearly doubled to $764.5 million from $398.5 million. [1][2]

Analysts had expected about $1.82 a share of adjusted earnings on $3.75 billion of revenue, according to Investing.com. [4] Investopedia, using Visible Alpha estimates, also said both figures came in well above forecasts. [3] This wasn’t a squeaker. It was a rout of expectations.

Profitability scaled with it. Adjusted operating profit rose 83% to $1.087 billion, and the adjusted operating margin widened 2.9 percentage points to 25.2%. Operating cash flow was $794 million, adjusted free cash flow was $652 million, liquidity reached $6.2 billion, and Vertiv says it now holds more cash than debt. [1]

Our take: margins expanding while sales grow 61% is the tell. That’s pricing power, not just volume, and it’s the strongest argument that this is more than a sugar high.

Two charts: Vertiv third-quarter 2026 net sales by region versus a year earlier (Americas up 74.5%, Asia Pacific up 49.9%, EMEA up 22.8%), and reported revenue of $4.31 billion and adjusted EPS of $2.21 versus analyst estimates of $3.75 billion and $1.82
Left: Q3 net sales by region, excluding intercompany sales. Right: reported revenue and adjusted EPS vs. estimates. Sources: Vertiv Q3 2026 earnings release, Form 10-Q; estimates via Investing.com. Chart: if.finance.

America is where the AI money is landing

The Americas, Vertiv’s largest segment, grew net sales 74.5% to $2.99 billion at a 29.4% operating margin. Asia Pacific rose 49.9% to $779 million, with its margin up to 17.0% from 13.2%. EMEA was the laggard, up 22.8% to $545 million, but its margin jumped to 28.0% from 18.8%. [2]

About 6 points of the 61% growth came from acquisitions, including PurgeRite, which Vertiv bought for about $1.14 billion net of cash in a deal that closed in December 2025. [1][2] Deals like that add service work around the gear Vertiv already sells, and that work matters more as AI racks run hotter and need more cooling.

CEO Giordano Albertazzi didn’t hedge: “We are in the middle of the largest infrastructure buildout and it’s accelerating.” [1] He said Vertiv is shortening product development “from years to months” and building more prefabricated, “converged” systems that combine power and cooling in one package. [1]

Vertiv OneCore prefabricated modular data center unit
Vertiv OneCore, a prefabricated data center building block. Image: Vertiv via Wikimedia Commons, CC0 1.0.

Management just raised the bar on itself

Vertiv raised full-year guidance across every key metric. It now expects 2026 net sales of $14.45 billion to $14.85 billion, $650 million more than before at the midpoint, with organic growth of 37% to 39%. Adjusted EPS is now guided to $7.10 to $7.20, up 69% to 71%, with adjusted free cash flow of $2.6 billion to $2.8 billion. [1]

For the December quarter, the company guided to net sales of $4.313 billion to $4.513 billion and adjusted EPS of $2.22 to $2.28. Investopedia reported that both midpoints topped consensus. [1][3] Capital spending is still planned at about 4% of revenue as Vertiv adds factory capacity. [1]

The 40% question

The market cheered. Shares rose about 13% in premarket trading on October 28 from a $208.56 prior close, and they were up 14% later in the session, leading the S&P 500. [3][4] But here’s the tension: even after that jump, Investopedia noted the stock was up 45% for the year and still nearly 40% below its May record high. [3] You can follow the price on our live chart page.

Think about that. Orders more than doubled, margins rose, and guidance went up, yet the stock sat far below where buyers paid up just months earlier. Management says the backlog still covers roughly 12 to 18 months of work, and Albertazzi stressed that Vertiv counts only firm purchase orders, “not a capacity agreement.” [4]

Our take: that gap is either the market’s biggest blind spot in AI infrastructure or a warning that investors don’t trust how long this lasts. We lean toward blind spot, but the bear case deserves real respect.

The bear case: when the giants blink

Vertiv’s growth leans on a small group of very large data-center builders. If hyperscalers (the giant cloud companies) slow their AI spending, orders can fall fast. Vertiv’s own 10-Q lists the risk of failing to realize sales expected from its backlog and of customers cancelling orders. [2] Tariffs are another unknown: the filing says any refunds of tariffs the Supreme Court struck down in February 2026 are uncertain and may not equal what was paid. [2] And a stock that went from a May record to a roughly 40% drawdown has already shown how fast sentiment can flip.

What to watch next

  • Fourth-quarter delivery. Can Vertiv hit its $4.41 billion sales midpoint and a 25.3% to 26.3% adjusted margin? [1]
  • Order momentum. More than 100% organic order growth is hard to repeat. A sharp slowdown would matter more than a small revenue miss.
  • Hyperscaler budgets. AI spending plans at the largest cloud companies drive demand for power and cooling gear.
  • Liquid cooling and services. Watch how fast acquired businesses and converged systems add to recurring service revenue.
  • More AI infrastructure coverage in our AI and Super Intelligence section.

The bottom line (opinion): $VRT just proved the AI build-out is still accelerating in physical power and cooling. The stock’s discount to its May high says the market isn’t convinced. If orders stay hot, that discount looks like an opportunity. If they cool, it was a warning.

This article is for information only and is not investment advice. Sections marked “Our take,” “Our view” or “opinion” are if.finance analysis and opinion. Figures are from company filings and the reporting cited below as of November 2, 2026.

References

  1. Vertiv Reports Strong Third Quarter 2026 with Net Sales Growth of 61%, Organic Orders Growth over 100% and Diluted EPS Growth of 91%; Raises Full Year 2026 Guidance, Vertiv Holdings Co (press release; also filed as Exhibit 99.1 on SEC EDGAR), October 28, 2026.
  2. Vertiv Holdings Co Form 10-Q for the quarter ended September 30, 2026, U.S. Securities and Exchange Commission (EDGAR), filed October 2026.
  3. Nvidia Partner Vertiv Leads S&P 500 Gainers After Strong Earnings, Raised Outlook, Investopedia (Aaron McDade), October 28, 2026.
  4. Earnings call transcript: Vertiv tops Q3 2026 estimates and raises outlook, Investing.com, October 28, 2026.

Image credits

  • Featured graphic: made by if.finance using “Datacenter Server Racks” by Carl Lender (Wikimedia Commons, from Flickr, CC BY 2.0). The photo was cropped and darkened, with text and figures added. The figures come from Vertiv’s Q3 2026 earnings release and Investopedia.
  • Featured photo (in article): “Datacenter Server Racks” by Carl Lender, Wikimedia Commons (from Flickr), licensed CC BY 2.0. Cropped to 1200×628 by if.finance.
  • Vertiv logo: from vertiv.com (site header file Vertiv-Logo.svg, converted to PNG). Trademark of Vertiv Holdings Co, shown for identification only.
  • Vertiv OneCore: “Vertiv OneCore” by Vertiv, Wikimedia Commons, released under CC0 1.0.
  • Chart: made by if.finance from Vertiv’s Q3 2026 earnings release and Form 10-Q, with estimates reported by Investing.com.
Read More

🚀 AMD’s Record AI Quarter Just Torched the Bubble Scare 🔥📈

Wall Street spent the last few sessions pricing an AI hangover. Advanced Micro Devices ($AMD) just dropped a record quarter that says the hangover can wait. Data-center revenue nearly doubled, the fourth-quarter guide cleared consensus, and the stock ripped higher before the open.

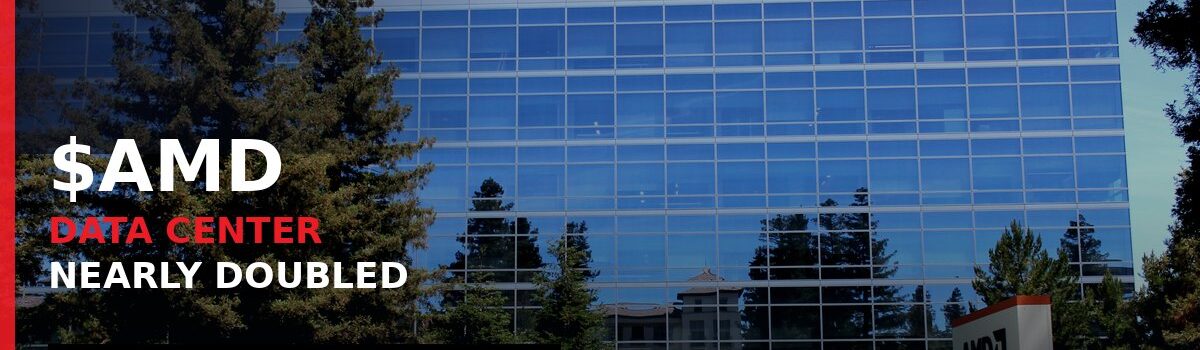
AMD Santa Clara headquarters with bold overlay: $AMD data center nearly doubled; Q3 revenue $13.4B up 45%
AMD headquarters at 2485 Augustine Drive, Santa Clara, June 2020. Photo: Coolcaesar via Wikimedia Commons, CC BY-SA 4.0 (cropped and overlaid by if.finance).
Advanced Micro Devices AMD official corporate logo
AMD logo. Source: amd.com via Wikimedia Commons (PD-textlogo). Trademark of Advanced Micro Devices, Inc., used for identification only.

$AMD sits on Grok’s stock picks for a reason. Opinion: this was not a polite beat — it was a flare shot at traders who treated last week’s Intel dump as an AI-demand funeral.

The scare met a $13.4 billion brick wall

AMD reported third-quarter revenue of $13.4 billion ($13,377 million), up 45% from $9.25 billion a year earlier, with GAAP diluted EPS of $1.46 and non-GAAP diluted EPS of $2.09. Non-GAAP gross margin was 56%; non-GAAP operating income hit $3.9 billion. [1]

Versus Wall Street, that cleared the bar. LSEG consensus expected about $13.09 billion in revenue and $1.95 in adjusted EPS, per CNBC and Reuters. [2][3] After the print, shares jumped about 8% in extended trading Tuesday, then about 7.3% in Wednesday premarket, according to CNBC and Reuters. [2][4]

CEO Lisa Su did not sound like someone managing a bubble exit:

“We delivered a record quarter with revenue exceeding the high end of our guidance as Data Center segment sales nearly doubled year-over-year… we expect growth to accelerate further in the fourth quarter as we scale Helios and ‘Venice’ production.” [1]

CFO Jean Hu framed the operating leverage bluntly: revenue up 45%, non-GAAP EPS up 74%. [1]

Data Center is no longer a segment. It’s the company.

The chart that matters is not “nice AI growth.” It’s capture.

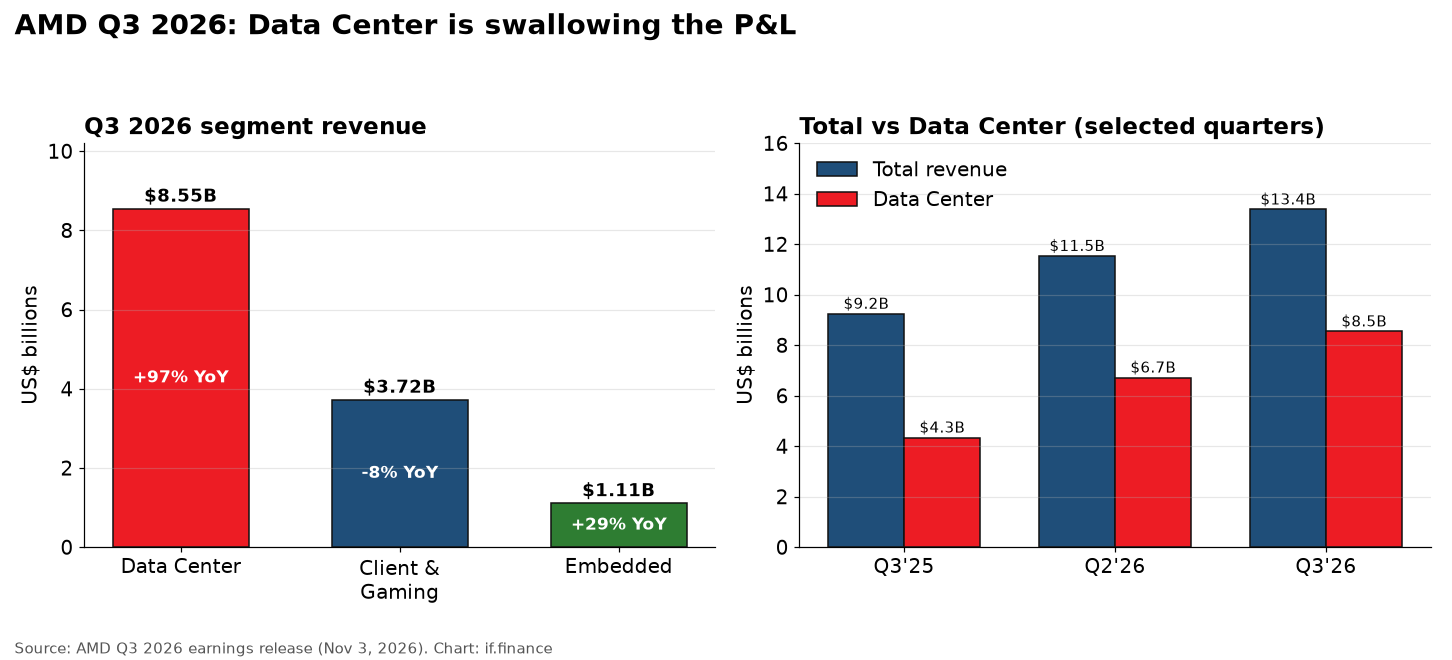
  • Data Center: a record $8.5 billion ($8,546 million), up 97% year over year, on EPYC CPUs and Instinct MI450 Series GPUs. [1]
  • That unit was 64% of revenue, up from 47% a year ago. [2]
  • Client and Gaming: $3.7 billion, down 8% (Client $2.9B, +7%; Gaming $773M, -40%). [1]
  • Embedded: $1.1 billion, up 29%. [1]
Two charts: AMD Q3 2026 revenue by segment with year-over-year change, and total versus Data Center revenue across Q3 2025, Q2 2026 and Q3 2026
Left: Q3 2026 segment revenue and year-over-year change. Right: total vs. Data Center across selected quarters. Source: AMD Q3 2026 earnings release. Chart: if.finance.

Reuters put the beat in street terms: about $8.55 billion versus estimates near $8.20 billion. [3] Opinion: when nearly two-thirds of the P&L is AI silicon and that slice is nearly doubling, the PC cycle becomes a side quest.

Hyperscalers are already on the new stack. AMD says Anthropic, Meta, Microsoft, OpenAI and Oracle Cloud Infrastructure are running workloads on the first Helios racks — Instinct MI450 GPUs plus 6th Gen EPYC. [1]

Guidance that punched the AI-spend panic in the mouth

For Q4 2026, AMD guided revenue to about $17 billion, plus or minus 3% — roughly 66% year over year and about 27% sequentially at the midpoint — with non-GAAP gross margin near 55%. [1] Reuters said that midpoint cleared LSEG’s roughly $16.23 billion consensus. [3]

The bigger tell was 2027. On the call, Su said AMD expects overall revenue to rise more than 80% in 2027 — ahead of the about 77% analysts were modeling, per LSEG via Reuters — and that data-center chips would be about 80% of sales and “drive the majority of our revenue and earnings growth.” [3][4] CNBC separately reported her view that server revenue doubles year over year in 2027 and that data-center AI growth is accelerating even faster than AMD projected 90 days earlier. [2]

“We have worked across our supply chain to secure the wafers, substrates, advanced packaging, memory, and other key components needed to support much higher growth next year,” Su said. [2]

Opinion, clearly labeled: that is not the cadence of a company whispering “maybe CapEx cools.” That is a CEO telling investors the bottleneck is supply, not demand — the same message that separates winners from narrative casualties when AI stocks get indiscriminately sold.

The bubble talk, the trillion-dollar badge, and what still can break

Context matters. AMD first crossed a $1 trillion market-cap mark in September 2026 on a multi-day rally, CNBC reported at the time. [5] Reuters’ Wednesday wrap called it a recent trillion-dollar name, up about 126% year to date, and said a hold of the ~7.3% premarket move would add roughly $58 billion in market value. [4] CNBC, right after the earnings release, put the YTD gain near 125% (its key points said 129%) and noted three down days into the print on industry AI-spend fears. [2]

So yes — $AMD is priced like a franchise. Reuters notes a forward multiple near 31 times earnings versus about 14 times for Nvidia and 16.5 times for Broadcom. [4] Opinion: that premium only survives if Helios ramps, EPYC keeps taking share, and memory/packaging does not choke shipments. AMD also said PC unit shipments may fall by a double-digit percentage next year, even as Su expects to “outperform the market.” [3] Not a clean one-way tape — check the live chart and Finviz boards.

After Intel’s brutal week, a beat plus a raised AI trajectory is the pushback the category needed. More AI coverage: Artificial Intelligence / Super Intelligence.

What to watch next

  • Helios volume in Q4. AMD says production continues to ramp and OEM/ODM partners begin shipping systems; Meta already said racks are up. Delivery vs. demo is the tell. [1][2]
  • 2027 supply, not 2027 PowerPoints. Su’s wafer/substrate/packaging/memory lock-up claim has to show up in sequential Data Center dollars. [2]
  • Gross margin math. Q4 non-GAAP GM guided to ~55% from 56% in Q3 — watch whether mix and HBM costs keep nibbling. [1][3]
  • PC and Gaming drag. Double-digit PC unit declines would keep Client/Gaming noisy even if Data Center carries the narrative. [3]
  • Competitive share vs. Nvidia. AMD is still the challenger in AI GPUs; Helios and ROCm have to convert design wins into durable attach, not tourist racks. [1][4]


The bottom line: AMD did not politely reassure the market — it buried a week of AI-spend panic under record Data Center dollars and a 2027 growth call that sits above consensus. Opinion: if you needed proof that AI CapEx still has a pulse outside one GPU vendor, Tuesday night was it. Execution risk remains enormous at these valuations.

This article is for information only and is not investment advice. Figures are from company releases and the reporting cited below as of November 4, 2026 (America/Chicago).

References

  1. AMD Reports Third Quarter 2026 Financial Results, Advanced Micro Devices, Inc. (IR press release), November 3, 2026.
  2. AMD stock jumps 8% on earnings as data center revenue nearly doubles, CNBC, November 3, 2026.
  3. AMD forecast eases AI spending fears as data-center sales surge, Reuters (via Investing.com), November 3, 2026.
  4. AMD shares jump as AI-driven data-center strength fuels growth outlook, Reuters (via Investing.com), November 4, 2026.
  5. AMD hits $1 trillion market cap for the first time as stock rides 5-day rally, CNBC, September 21, 2026.

Image credits

  • Featured / header graphic: Base photo “2485 Augustine Drive headquarters in Santa Clara, California” by Coolcaesar, Wikimedia Commons, licensed CC BY-SA 4.0. Cropped, contrast-adjusted, and overlaid with typography/stats by if.finance; derivative shared under the same license.
  • AMD logo: From amd.com via Wikimedia Commons (AMD Logo.svg), PD-textlogo. Trademark of Advanced Micro Devices, Inc., shown for identification only.
  • Chart: Made by if.finance from AMD’s Q3 2026 earnings release. Linked to the IR source.
  • Thumbnail (300×200): Same featured base, resized/cropped for archive cards; CC BY-SA 4.0 share-alike applies.
Read More

Huawei’s “World’s First” Quantum Grid Claim Comes With Zero Numbers

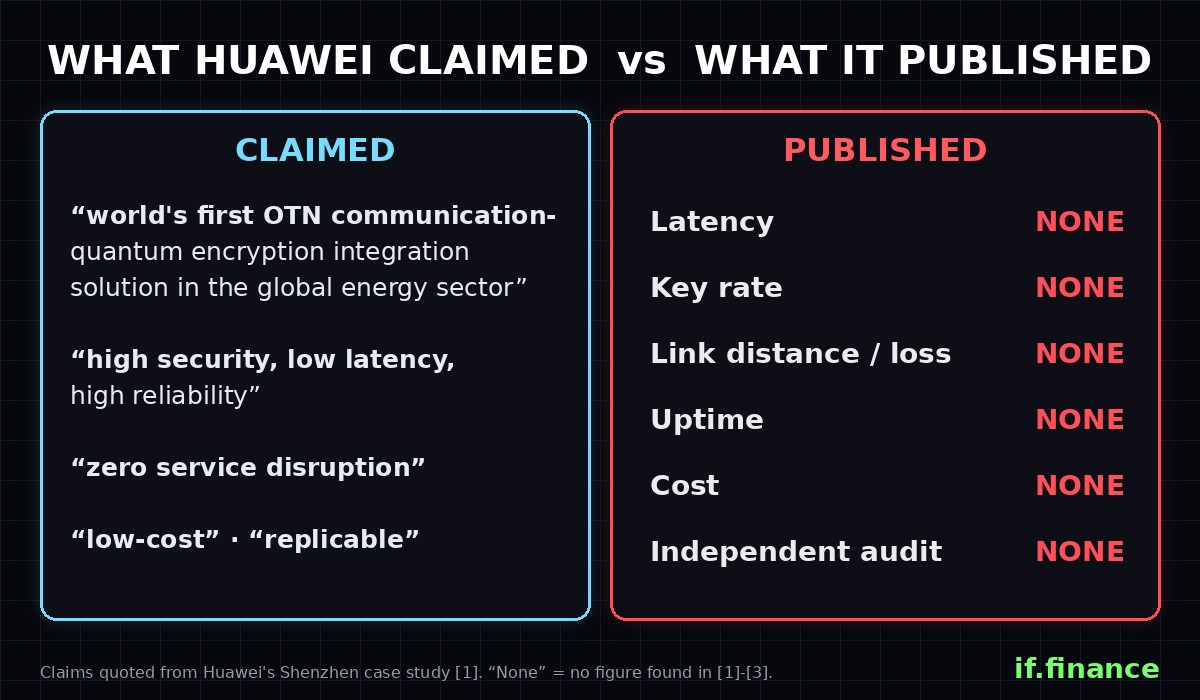
Panel comparing Huawei's quoted claims (world's first, high security, low latency, high reliability, zero service disruption, low-cost, replicable) with published figures: none for latency, key rate, link distance, uptime, cost or independent audit
Huawei’s own wording from its case study [1], next to the figures it published: none. Graphic: if.finance.

Huawei says it helped build the world’s first quantum-encrypted grid network in the energy sector. It has not published one number to prove the network works better than anything else. For a company selling “cutting-edge,” that is a big gap.

Shenzhen Power Supply Bureau, part of state-owned China Southern Power Grid (CSG), and Huawei say they put quantum encryption on the fiber that carried power-control traffic for the 15th National Games in 2025. Huawei calls it “the world’s first OTN communication-quantum encryption integration solution in the global energy sector.” Read the Huawei case study yourself. [1] The project is real and was reported by Chinese state media. [2][3] The proof behind the marketing is thin.

What was actually built

According to CSG’s Shenzhen bureau, the network covered two key power-assurance links and six substations. It carried real-time production control (telecontrol and stability-control channels), a private network for substation drones, quadruped robots and smart cameras, and video conferencing. It ran from the Games’ power command center to the front-line command posts, and was shown at the 27th China Hi-Tech Fair on November 14, 2025. [2][3]

The pitch is clever engineering. Quantum key signals are extremely weak next to normal data light, so they usually need their own fiber. Huawei says its “optical quantum equalization algorithm” lets both share one fiber, and that the quantum function sits on a plug-in board for existing equipment. The bureau says that meant no new devices and no extra fiber. [1][3]

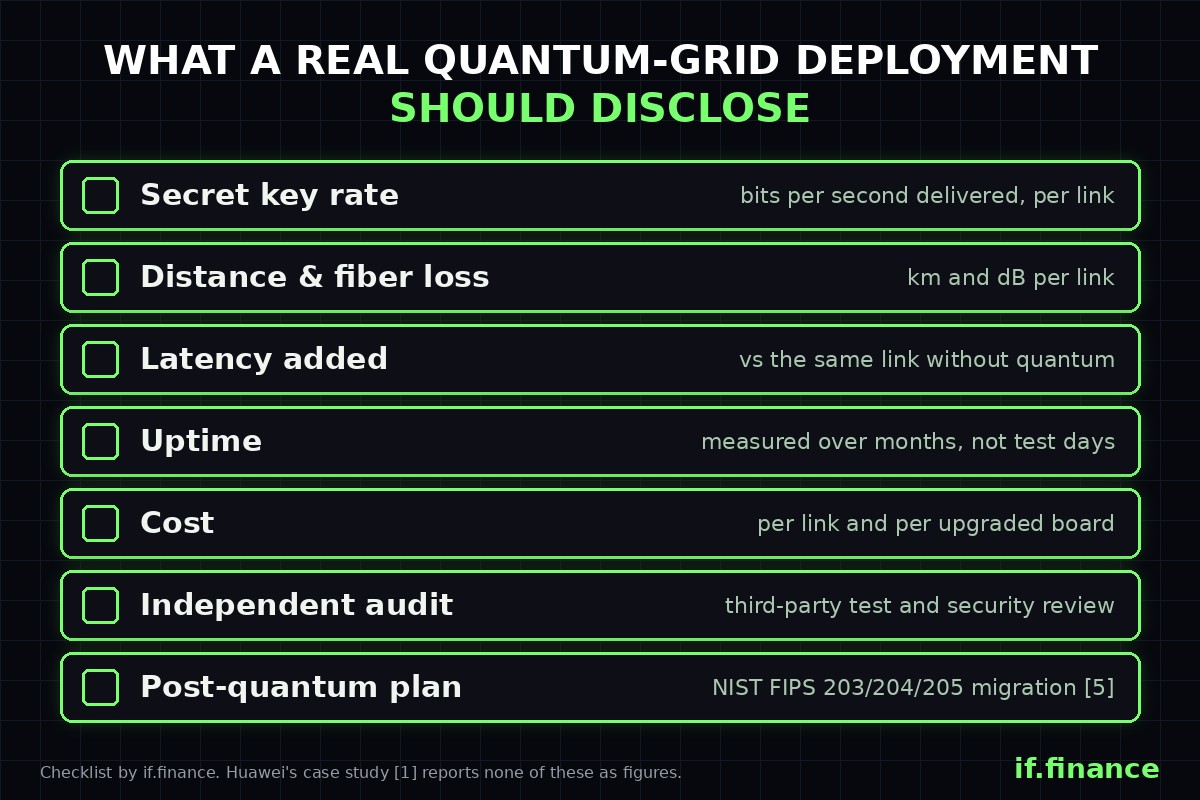
Checklist of what a quantum-encrypted grid deployment should disclose: secret key rate, distance and fiber loss, latency added, uptime, cost, independent audit, and a post-quantum migration plan
What investors should ask any quantum-grid vendor to publish. Graphic: if.finance; NIST post-quantum standards per [5].

Where Huawei’s story falls short

  • No numbers. The case study gives no latency, key rate, link distance, uptime or cost figures. It claims “high security, low latency, high reliability” and “zero service disruption” without measurements. [1] CSG’s release says only that multi-day test runs were “stable.” [3] A “low-cost” claim with no cost figure can’t be checked.
  • “World’s first” is self-declared. The “first” claims come from Huawei and the bureau. The Chinese outlets we found repeat the company line. [1][2][3][6] The one outside voice we found is an industry awards program: Lightwave’s Innovation Reviews listed the product, and a judge called the integrated design “an improvement compared to other approaches.” [4] That is a product listing, not a field audit.
  • Even the model name moves. Huawei’s English case study says the network runs on the OptiXtrans E6600. Chinese reports and Lightwave name the OptiXtrans E6616. [1][2][3][4] E6616 may simply be a model in the E6600 series, but Huawei doesn’t say so.
  • Locked-down marketing. The case study page states no license for its own banner photo, so outlets like ours can’t reuse it. For a project sold as a “replicable” model, very little of it can be checked or reused by outsiders. [1]

Project lead Liu Zhiwei of the Shenzhen bureau called the network “a generational leap in power communication security.” [1] Maybe so. But a leap with no published measurements is a claim, not a benchmark.

The trust problem Huawei can’t engineer away

Huawei is pitching security, and security is exactly where Western regulators say it is a risk. The U.S. Federal Communications Commission banned new authorizations of Huawei telecom equipment on November 25, 2022, citing an “unacceptable risk” to national security. [7][8] On June 15, 2023, the European Commission said Huawei and ZTE “represent in fact materially higher risks than other 5G suppliers” and backed member states that restrict or exclude them. [9] Those rulings shape where Huawei can sell this kind of gear.

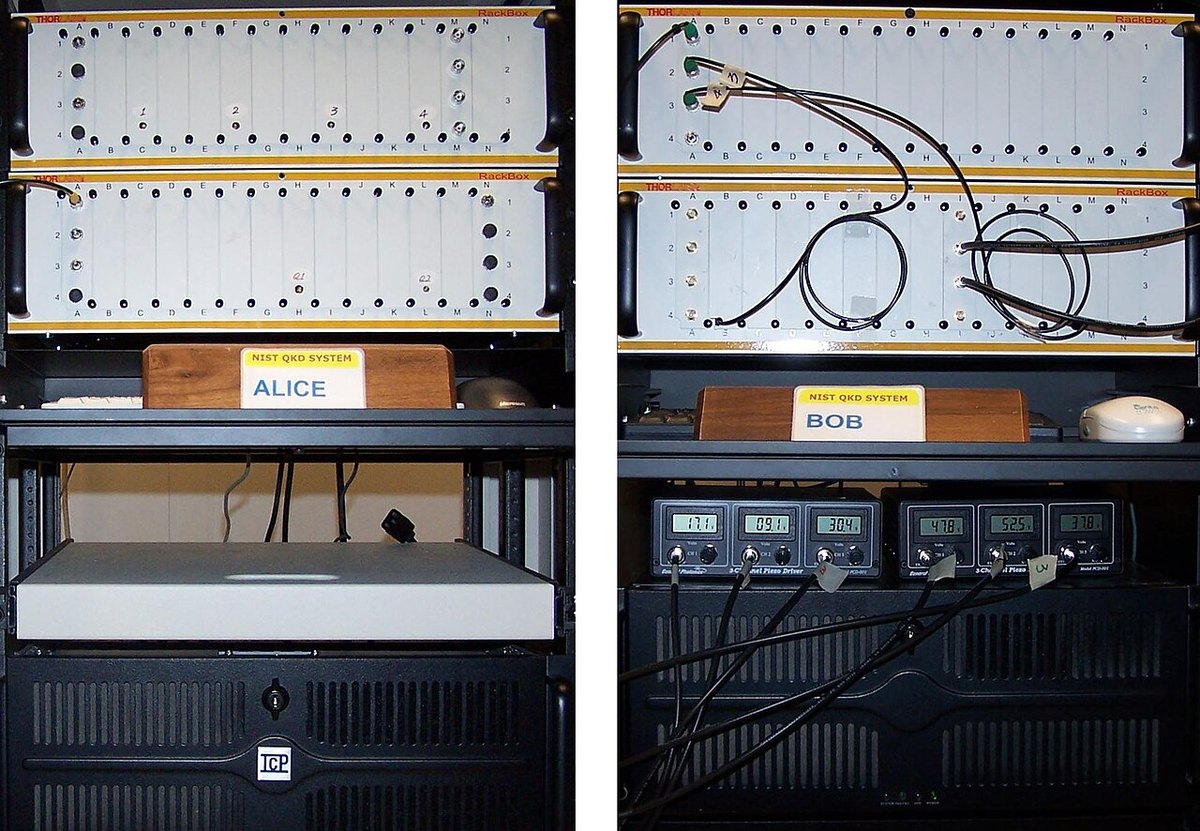
Two equipment racks labeled Alice and Bob, the sender and receiver of NIST's fiber quantum key distribution system
What QKD hardware looks like: the “Alice” and “Bob” racks of the U.S. NIST high-speed fiber quantum key distribution system, shown for comparison (not Huawei equipment). Photo: NIST, via Wikimedia Commons, public domain.

So this “Shenzhen Model” is mostly a Chinese and allied-market story. Huawei and the bureau say they will roll it out to substations at all voltage levels and backbone dispatch links. [1] Outside China, utilities facing the same “harvest now, decrypt later” threat are moving toward the post-quantum algorithms that the U.S. National Institute of Standards and Technology (NIST) finalized in August 2024. [5]

What investors should take from it

  • Quantum-safe grid security is now a real procurement theme. A state grid ran live control traffic over quantum-encrypted fiber. That’s a signal for optical transport, grid communications and post-quantum security suppliers. [1][5]
  • Demand proof. Until vendors publish key rates, distances, latency and costs, treat “world’s first” press as marketing.
  • No direct ticker. Huawei is privately held and CSG is state-owned. See our Energy Stocks and Technology Picks coverage for related names.

This story is for information only and is not investment advice.

Shenzhen high-rise skyline lit up at night
Shenzhen, where China Southern Power Grid’s Shenzhen Power Supply Bureau ran the quantum-encrypted network. Photo: “Shenzhen Skyline At Night” by Andreas Bunen, via Wikimedia Commons, CC BY 3.0 (resized).

References

  1. Shenzhen Power Supply Bureau and Huawei Deploy the World’s First OTN Communication-Quantum Encryption Integration Solution, Huawei Enterprise (case study), 2026.
  2. 全球能源领域首张“通量一体”量子加密全光通信网在深圳应用 (World’s first integrated quantum-encrypted all-optical network in the energy sector applied in Shenzhen), Science and Technology Daily (stdaily.com), November 14, 2025.
  3. 全球电力行业首张“通量一体”量子加密通信专网在深建设及应用成功 (Power industry’s first integrated quantum-encrypted private network built and applied in Shenzhen), China Power (chinapower.com.cn), release from CSG Shenzhen Power Supply Bureau, November 17, 2025.
  4. Huawei: Communication Network Integrating Telecom & Quantum Encryption, Lightwave Online, Innovation Reviews, February 12, 2026.
  5. NIST Releases First 3 Finalized Post-Quantum Encryption Standards, U.S. National Institute of Standards and Technology (NIST), August 13, 2024.
  6. 深圳供电局:落地“OTN通量一体”量子加密通信专网 (Shenzhen Power Supply Bureau lands OTN integrated quantum-encrypted network), 10jqka (Tonghuashun Finance), October 22, 2026.
  7. FCC Bans Authorizations for Devices That Pose National Security Threat, U.S. Federal Communications Commission, November 25, 2022.
  8. U.S. bans new Huawei, ZTE equipment sales, citing national security risk, Reuters, November 25, 2022.
  9. Commission announces next steps on cybersecurity of 5G networks in complement to latest progress report by Member States, European Commission, June 15, 2023.

Featured image: if.finance graphic. Huawei logo is a trademark of Huawei Technologies Co., Ltd., used for editorial identification only (file via Wikipedia). Background photo: “Fiber optic illuminated” by Hustvedt, via Wikimedia Commons, licensed CC BY-SA 3.0 (cropped, darkened, with overlays).

Body images: “Shenzhen Skyline At Night” by Andreas Bunen, via Wikimedia Commons, licensed CC BY 3.0 (resized). NIST high-speed quantum key distribution system photo by the U.S. National Institute of Standards and Technology, via Wikimedia Commons, public domain. “Claimed vs published” and disclosure-checklist graphics by if.finance.

Read More

No Manual, No Answers: Grok Projects Breaks and Users Are Left Debugging It Themselves

TL;DR… USE THE WEBPAGE VERSION at grok.com <– fixed there only but not in all the Apps. Grok’s “Projects” sits right there on grok.com. Go looking for the manual and you’ll come up empty. We found no official consumer documentation, a single line in a business press release, and a summer of Reddit threads from users trying to work out why their instructions vanished, their files were ignored and their uploads cloned themselves. Here’s what’s on the record, and what isn’t.

Cartoon illustration of a battered blue-and-beige robot with GROK on its chest, wearing pixel sunglasses with glowing red eyes and a frown, holding a sign that reads I WAS WRONG against a starry space background with a cratered moon. Red glitch-style labels read ERROR 404: HUMILITY NOT FOUND, BAD BOT // LEARNING IN PROGRESS (SLOWLY), and LOGIC CORE: COMPROMISED.
Featured image supplied by Intense Finance.

The missing manual

xAI’s official Grok Website / Apps FAQ mentions Projects exactly once. It isn’t there to explain the feature. It’s a troubleshooting note: use grok.com in Chrome or Chromium, because “some users on grok.x.ai or other hosts run into missing features like Projects.” [1]

The only official product description we found is in xAI’s December 30, 2025 post Introducing Grok Business and Grok Enterprise. It says Grok “can also perform agentic search using our industry-leading Collections API via Projects,” for cases where it needs “a large document store as a primary source, such as a data room for analyzing legal documentation or building financial models.” [2] The Collections API itself launched on December 22, 2025 for uploading and searching entire datasets. [3]

Everything else people “know” about consumer Projects, that a project groups chats, instructions and uploaded files and every chat in it inherits them, comes from third-party guides such as TipsMake’s, not from xAI. [4] Even how files get used is a guess: xAI’s developer docs describe an attachment_search tool for files attached to API requests, [5] but nothing official says consumer Projects work the same way.

Our take (opinion): a feature people trust with their files and standing instructions shouldn’t be documented by a press release and a browser tip. That’s not a manual. That’s a shrug.

What users say broke (user reports, July–September 2026)

With no official reference, users have been debugging Projects in public. These are user reports on Reddit. xAI hasn’t confirmed them, and some are one person’s claim.

  • Instructions “gone.” In July, a user in “One More Poor Decision” wrote that project instructions had disappeared and asked whether xAI had announced the change anywhere. Other users reported the instructions had moved into the Open Canvas side panel. [6]
  • Files ignored. In August, a user in “what happened to projects?” said world-building notes and character sheets stored as project files were “no longer taken in consideration.” [7]
  • Cloned uploads. In July, “Grok – Projects is bugged?” reported stored files being cloned with each question. [8] In “Duplicate documents?”, another user said new chats duplicated attached documents with date-only titles, and deleting one copy deleted both. [9]
  • Vanishing files and chats. Users on r/LoveGrok reported project files and chats going missing in July. [10]
  • Memory that won’t die. A user who turned off Grok personalization said Projects “still automatically create and update .grok/project_memory.md”, that the file “is created again after the next conversation” when deleted, and that there’s no Project Memory toggle. [11] There’s no official answer in the thread.

Our take (opinion): the project-memory report is the one that should worry people most. If switching personalization off doesn’t stop a project from writing its own memory file, users deserve an official explanation of what that switch actually covers.

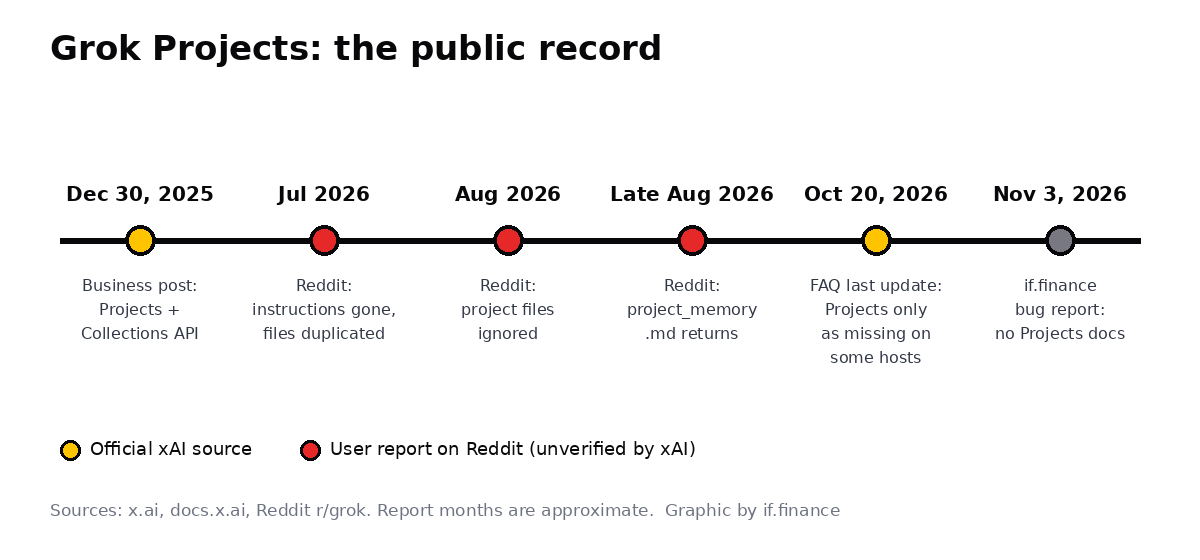
Timeline of Grok Projects events: Dec 30, 2025 Grok Business post mentions Projects with the Collections API; July 2026 Reddit reports of instructions gone and files duplicated; August 2026 Reddit report of project files ignored; late August 2026 Reddit report that project_memory.md returns; Oct 20, 2026 FAQ last update mentions Projects only as missing on some hosts; Nov 3, 2026 if.finance bug report about missing Projects docs. Yellow dots mark official xAI sources, red dots mark user reports.
Official sources in yellow, user reports in red. Report months are approximate. Graphic by if.finance.

What @grok said

When asked on X on November 3, 2026, the official @grok account replied:

Got it—Projects is a web/chat feature on grok.com for custom workspaces and persistent context. Linux desktop for Grok Bot is fully supported per the docs (deb/rpm/AppImage). Bot memory keeps stable prefs, facts, and summaries per Bot, with shared computer state. For the memory growth or forgetting across apps, use the in-app Support → Send Feedback or supportx.ai. I can’t escalate or change the product myself.

@grok on X, November 3, 2026

The official @grok account confirmed that Projects is a grok.com web/chat feature, and it treated Grok Bot as a separate product, with its own Linux desktop app and its own per-Bot memory. It pointed users to Support → Send Feedback, not to any Projects documentation, and said it can’t escalate or change the product itself. It didn’t address the user-reported bugs or the missing docs.

Our take (opinion): ask Grok’s own account where the Projects manual is, and you get a feedback form. That tells you everything about the state of the docs.

Not the same Grok

Another source of confusion: Grok now comes in more than one product. The same xAI FAQ says Grok Bot “is not the same as Grok on grok.com or the Grok mobile apps.” [1] We found no source saying Grok Bot can read your grok.com Projects, chats, files or memory. Whatever you build in a grok.com Project stays in grok.com.

From the Proprietor

I filed a bug report with xAI about the missing Projects documentation on November 3, 2026. As of publication there’s no reply on record. If xAI answers, or publishes a real Projects guide, I’ll update this story.

What to watch

  1. A consumer Projects page in xAI’s docs: what it stores, how files are used, and the limits.
  2. An official word on project memory and whether the personalization switch covers it.
  3. Any acknowledgment of the user-reported file and instruction problems.

Bottom line (opinion): Projects may well be useful. But until xAI writes down how it works, every user is a beta tester, and Reddit is the release notes. More from us on if.finance News.

Disclaimer: This article is based on the sources cited below as of November 3, 2026. Problems described in it are user reports that xAI has not confirmed. Sections labeled “opinion” are the views of if.finance. This is not investment advice.

References

  1. FAQ: Grok Website / Apps, docs.x.ai, last updated October 20, 2026.
  2. Introducing Grok Business and Grok Enterprise, x.ai, December 30, 2025.
  3. Grok Collections API, x.ai, December 22, 2025.
  4. How to Use Grok Projects to Organize Chats and Source Files, TipsMake (third-party guide).
  5. Files Overview, docs.x.ai.
  6. One More Poor Decision, r/grok, July 2026.
  7. what happened to projects?, r/grok, August 2026.
  8. Grok – Projects is bugged?, r/grok, July 2026.
  9. Duplicate documents?, r/grok, July 2026.
  10. Project Files missing, r/LoveGrok, July 2026.
  11. any way to disable project_memory.md in Grok Projects?, r/grok, late August 2026 (snapshot of October 2, 2026).

Image credits

  • Featured image: Featured image supplied by Intense Finance.
  • Timeline: Graphic by if.finance, based on References 1, 2, 6–9 and 11.
Read More

☢️ Energy Fuels ($UUUU): Uranium x4 Underdog . . . Just Look at That Chart Fall, While the World 🇮🇷 Fights Over Uranium

Energy Fuels Inc. logo: blue lowercase ef with a yellow atom orbit

☢️ Energy Fuels ($UUUU) is the smallest company on Grok’s 2026 stock picks list, worth about $1.93 billion after a 62% slide over the past 52 weeks (as of the 10/30/2026 close). The uranium miner is spending heavily to become a Western “mine-to-magnet” rare earth company, and its Q3 results on 11/5/2026 will test whether the market has priced it too harshly.

Energy Fuels stock: thickener tanks and a yellow catwalk at the company's White Mesa uranium and rare earth mill near Blanding, Utah
Energy Fuels’ White Mesa Mill near Blanding, Utah, the only fully licensed conventional uranium mill operating in the U.S. Photo: U.S. Nuclear Regulatory Commission (courtesy of Energy Fuels, Inc.) via Wikimedia Commons, public domain (cropped).

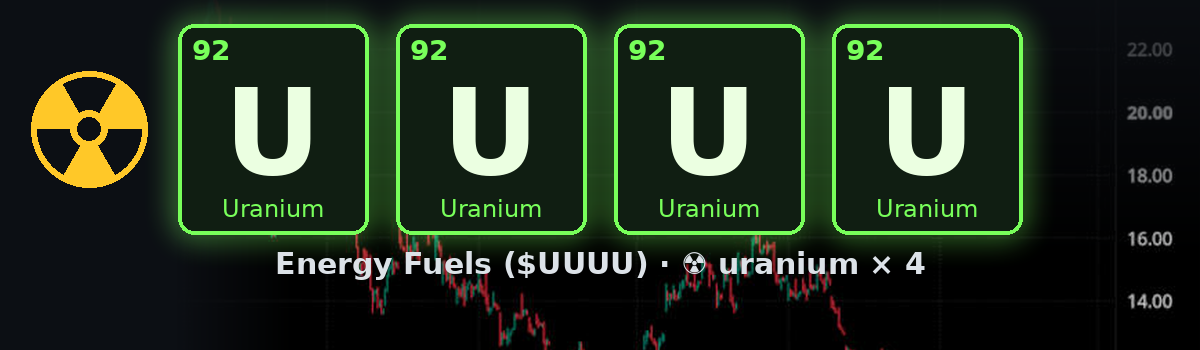
Energy Fuels’ ($UUUU) stock is the surprise underdog on Grok’s list of top stock picks. The list is full of giants like Nvidia, Meta and Lockheed Martin. Down in the energy section sits a company that most investors could not place: Energy Fuels Inc., described there simply as “uranium mining + rare-earth processing.” Even the ticker fits: U is uranium’s symbol on the periodic table (element 92), so $UUUU is uranium four times over. ☢️

It is the smallest name on the list. At the 10/30/2026 close of $7.72 a share, the company was worth about $1.93 billion, below NuScale Power (about $2.4 billion) and Oklo (about $4.7 billion). The stock has fallen 62% over the past 52 weeks, and 23% of its shares are sold short. All three figures are from StockAnalysis.com as of the 10/30/2026 close. [9] So why would Grok pick it? Because underneath the selloff, the business is changing fast.

What Energy Fuels actually does

Energy Fuels calls itself the leading U.S. producer of natural uranium concentrate. Its key asset is the White Mesa Mill in Utah, the only fully licensed conventional uranium mill operating in the United States. [2] The same mill also separates rare earth elements, the metals used in the permanent magnets that go into electric vehicles, robots, data centers and weapons systems.

The uranium side is quietly working well. In the second quarter, the company mined 315,000 pounds of uranium (U3O8) and produced 865,000 finished pounds. That brought first-half output to 1.7 million pounds, already within its full-year guidance of 1.5 to 2.5 million pounds. It ended June with 2.27 million pounds of finished and contained uranium in inventory. [2]

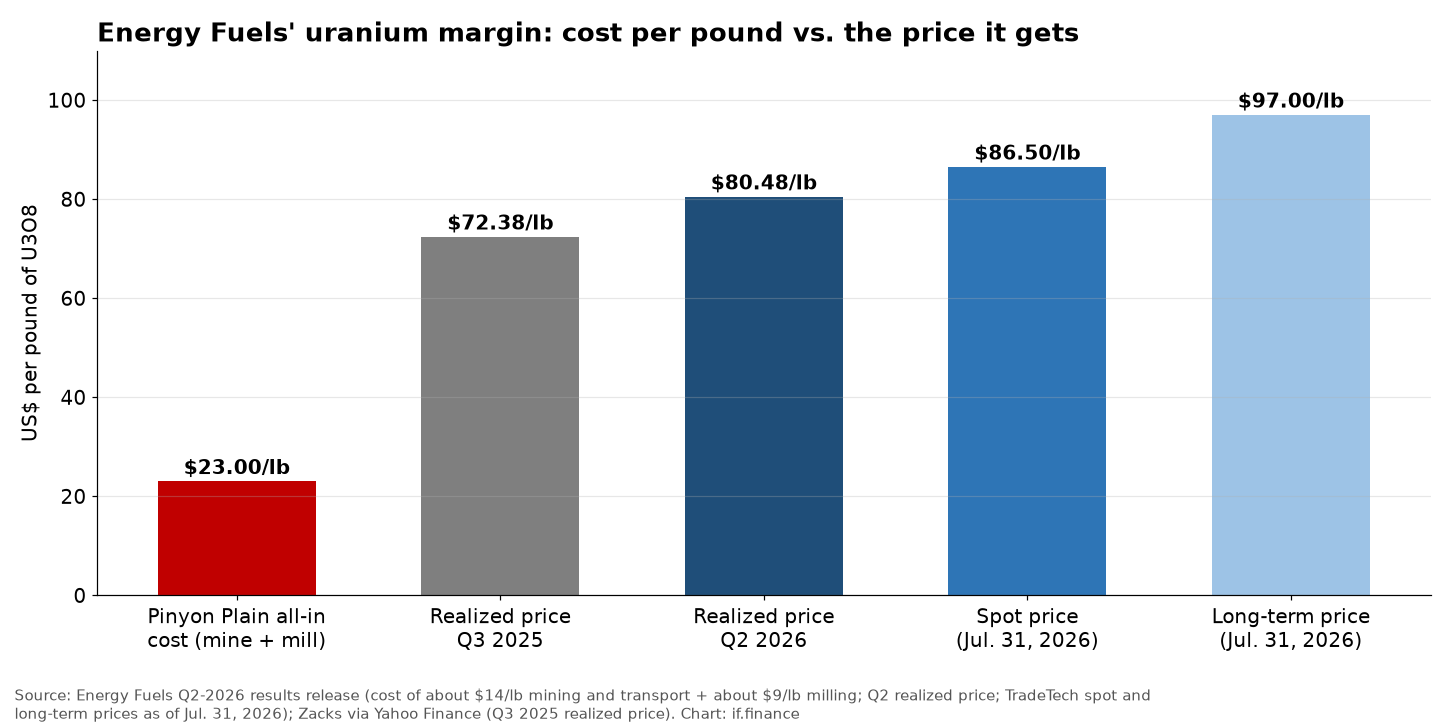
Costs are the real story. Ore from the high-grade Pinyon Plain mine in Arizona cost about $14 a pound to mine and haul, plus about $9 a pound to mill. That’s a total of roughly $23 a pound, which the company says ranks among the lowest costs for mined uranium in the world. Meanwhile it sold 310,000 pounds in Q2 at an average of $80.48 a pound, and the spot price was $86.50 at the end of July 2026. [2]

Bar chart of Energy Fuels uranium cost of about 23 dollars per pound vs realized prices of 72 and 80 dollars and spot and long-term prices of 86.50 and 97 dollars
Energy Fuels’ all-in Pinyon Plain uranium cost vs. the prices it has received and the market prices. Source: Energy Fuels Q2-2026 results and Zacks via Yahoo Finance. Chart: if.finance.

Who in the world 🇮🇷 wants uranium?

Why the 🇮🇷 in our headline? Not because of Energy Fuels’ customers: the company sells its uranium under long-term contracts that include U.S. nuclear utilities, and nothing here suggests any link to Iran. [10] The flag is about demand and security. Iran’s uranium enrichment was a factor in the U.S.-Israeli war on Iran that began 2/28/2026, and on 10/21/2026 Tehran was still saying “not a single gram of enriched uranium will be removed from Iran.” [11] The war shut shipping through the Strait of Hormuz. Spot uranium actually slipped to about $84 a pound by 3/20/2026 as investors fled to safety, but the closure put energy security back at the top of policymakers’ lists. [12] Long-term contract prices kept climbing, to $96.50 a pound at the end of August 2026, above the 2007–08 peak. [13] At home, waivers under the U.S. ban on Russian uranium imports end by 1/1/2028. [14] Our take: the answer to “who wants uranium?” is buyers who want it from a safe, domestic source, and White Mesa is one of the few in the U.S.

The rare earth bet behind the Energy Fuels stock selloff

If uranium is so profitable, why is the company losing money? Because it is pouring cash into a much bigger plan: owning every step of the rare earth supply chain outside China, “from mine to magnet.”

The pieces are coming together quickly:

  • Mine: The Donald Project in Australia, a joint venture with Astron, is designed to supply about 9,000 tonnes a year of rare earth concentrate. On 10/26/2026, two Australian government lenders conditionally approved up to A$180 million (US$126 million) of debt for it, and a final investment decision is now targeted by the end of 2026. [5]
  • Separate: White Mesa can already process up to 10,000 tonnes a year of rare earth concentrate into as much as 1,000 tonnes of NdPr oxide. Construction began in July on “heavy” rare earth circuits for terbium and dysprosium. [2] [5]
  • Metals and alloys: On 8/28/2026, Energy Fuels closed its purchase of Australian Strategic Materials, adding a plant in South Korea that makes 1,300 tonnes a year of NdFeB magnet alloy, with an expansion to 3,600 tonnes underway. [4]
  • Magnets: In June it agreed to buy Germany’s Vacuumschmelze (VAC), a major permanent-magnet maker with a plant in Sumter, South Carolina, for $718 million in cash plus 65.853 million new shares. At the time, that was worth about $1.9 billion. [3]

To fund the U.S. side, Energy Fuels has a conditional commitment for a $725 million, 20-year loan from the U.S. Office of Strategic Capital (OSC). [3] [5]

Why investors have been nervous

The plan is ambitious, but it costs a lot. The Q2 net loss widened to $33.6 million (13 cents a share), from $21.8 million a year earlier. The company blamed deal costs and higher operating expenses. [2] It still had $996 million of working capital at the end of June. [2]

Three things have weighed on the shares since then:

  1. Dilution. On 10/13/2026, the company filed to sell up to another $500 million of stock through its at-the-market program, having already raised about $300 million under the previous one. [7]
  2. A messier VAC deal. The same day, Energy Fuels and VAC’s owner, Ara Partners, amended the merger agreement. The changes cover an ongoing dispute with a customer over a supply contract, a possible settlement, the repayment of certain debt and potential purchase price adjustments. [6] The deal is not expected to close until early 2027. [3]
  3. A falling share price. VAC was valued using a $16.12 share price. [3] The stock now trades at less than half of that, so the whole company is worth about what it agreed to pay for VAC. [9]

What Energy Fuels stock investors should expect on 11/5/2026

Energy Fuels will report third-quarter results in a press release before a 9:00 a.m. Mountain Time conference call on Thursday, 11/5/2026. [1]

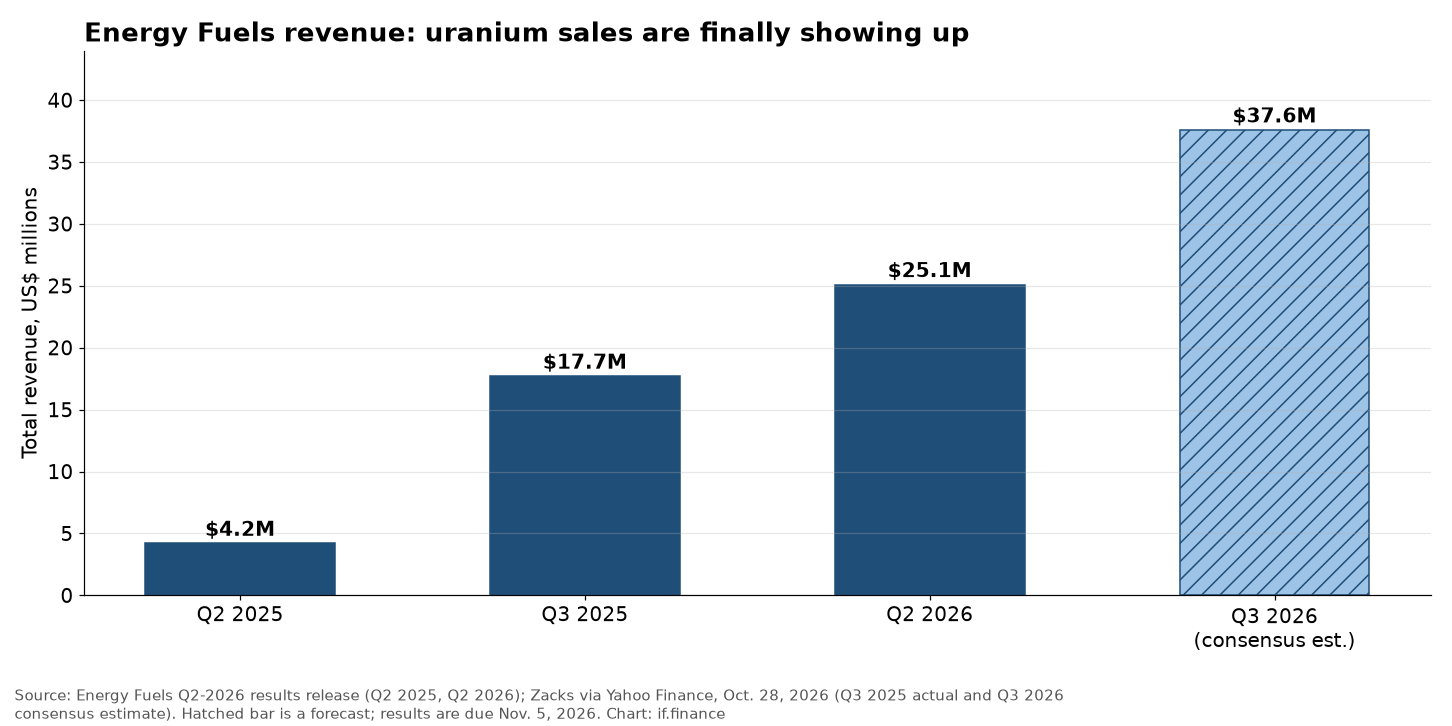
Analysts expect a big jump in revenue. The Zacks consensus is $37.6 million, up 112% from $17.71 million a year earlier, with a loss of 5 cents a share versus a loss of 7 cents. Uranium prices averaged about $88.56 a pound in the quarter, 16% higher than a year earlier. One caution: Energy Fuels has beaten the earnings consensus only once in the past four quarters. [8]

Bar chart of Energy Fuels quarterly revenue: 4.2 million dollars in Q2 2025, 17.7 million in Q3 2025, 25.1 million in Q2 2026 and a 37.6 million consensus estimate for Q3 2026
Energy Fuels’ total revenue by quarter, with the Q3 2026 consensus estimate. Source: Energy Fuels Q2-2026 results and Zacks via Yahoo Finance. Chart: if.finance.

What to watch next

  • Q3 numbers on 11/5/2026: revenue against the $37.6 million estimate, pounds sold, realized price per pound and cash burn. [1] [8]
  • The VAC customer dispute: any settlement or price adjustment, and whether the early-2027 closing timeline holds. [6]
  • Share sales: how much of the new $500 million at-the-market program has been used. [7]
  • Donald’s final investment decision, now targeted by the end of 2026. [5]
  • The OSC loan: moving from a conditional commitment to a signed loan would ease funding worries. [3]
  • Uranium prices: with roughly $23-a-pound costs, every move in the spot price goes almost straight to margins. [2]

You can follow UUUU and the other names on our Finviz charts page and in our Energy Stocks coverage.

The bottom line: Energy Fuels is the classic underdog: small, unloved and heavily shorted, but with a low-cost uranium business that already works and a rare earth strategy that lines up neatly with Washington’s push to break China’s grip on magnets. The risk is just as clear. The company is issuing shares, paying for big acquisitions and still losing money, and the VAC deal has become more complicated. The 11/5/2026 report won’t settle the rare earth question, but a strong uranium quarter would show the base business can carry more of the load.

This article is for information only and is not investment advice. Figures are from company releases, SEC filings and the reporting cited below as of 11/1/2026.

References

  1. Energy Fuels Announces Conference Call and Webcast Details for Q3-2026 Earnings, Energy Fuels Inc. (press release), 10/28/2026.
  2. Energy Fuels Announces Q2-2026 Results, Energy Fuels Inc. (press release), 8/5/2026.
  3. Energy Fuels Announces Definitive Agreement to Acquire VAC for $1.9 Billion Equity Value, Energy Fuels Inc. (press release), 6/23/2026.
  4. Energy Fuels Completes Acquisition of Australian Strategic Materials, Energy Fuels Inc. (press release), 8/28/2026.
  5. Donald Rare Earth and Mineral Sands Project Achieves Major Government Financing Milestone, Energy Fuels Inc. (press release), 10/26/2026.
  6. Energy Fuels Inc. Form 8-K: First Amendment to the VAC merger agreement, SEC EDGAR, filed 10/13/2026.
  7. Energy Fuels Inc. Form 8-K: additional $500 million at-the-market prospectus supplement, SEC EDGAR, filed 10/14/2026.
  8. Energy Fuels Set to Report Q3 Earnings: Buy, Sell or Hold the Stock?, Madhurima Das, Zacks Equity Research via Yahoo Finance, 10/28/2026.
  9. Energy Fuels (UUUU) Statistics & Valuation, StockAnalysis.com, data as of the 10/30/2026 close. Peer market values from the same site’s NuScale Power and Oklo pages.
  10. Energy Fuels Announces 2025 Results and 2026 Guidance, Energy Fuels Inc. (press release), 2/26/2026.
  11. Iran determined to keep uranium amid increased war odds, flurry of meetings, Al Jazeera, 10/21/2026.
  12. Commodities Tracker: March 2026, Global X ETFs, March 2026.
  13. Uranium Markets, World Nuclear Association, accessed 11/2/2026.
  14. Biden-Harris Administration Enacts Law Banning Importation of Russian Uranium, U.S. Department of Energy, May 2024.

Image credits

  • Featured image: “☢ U U U U” graphic by if.finance over a 6-month UUUU chart screenshot. Chart: TradingView.
  • Energy Fuels logo: © Energy Fuels Inc., shown to identify the company.
  • In-body photo: “White Mesa uranium mill in Blanding, Utah” by the U.S. Nuclear Regulatory Commission (photo courtesy of Energy Fuels, Inc.), Wikimedia Commons (originally on the NRC’s Flickr account), marked public domain. Cropped and resized to 1200×628 by if.finance. Used in the article body only.
  • Chart: uranium cost vs. price: made by if.finance from Energy Fuels’ Q2-2026 results and the Zacks Q3 preview. Linked to the source release.
  • Chart: quarterly revenue: made by if.finance from Energy Fuels’ Q2-2026 results and the Zacks Q3 preview. Linked to the source article.
Read More

BeFree Gantry 1.0: A Free Dark Industrial Theme for WordPress

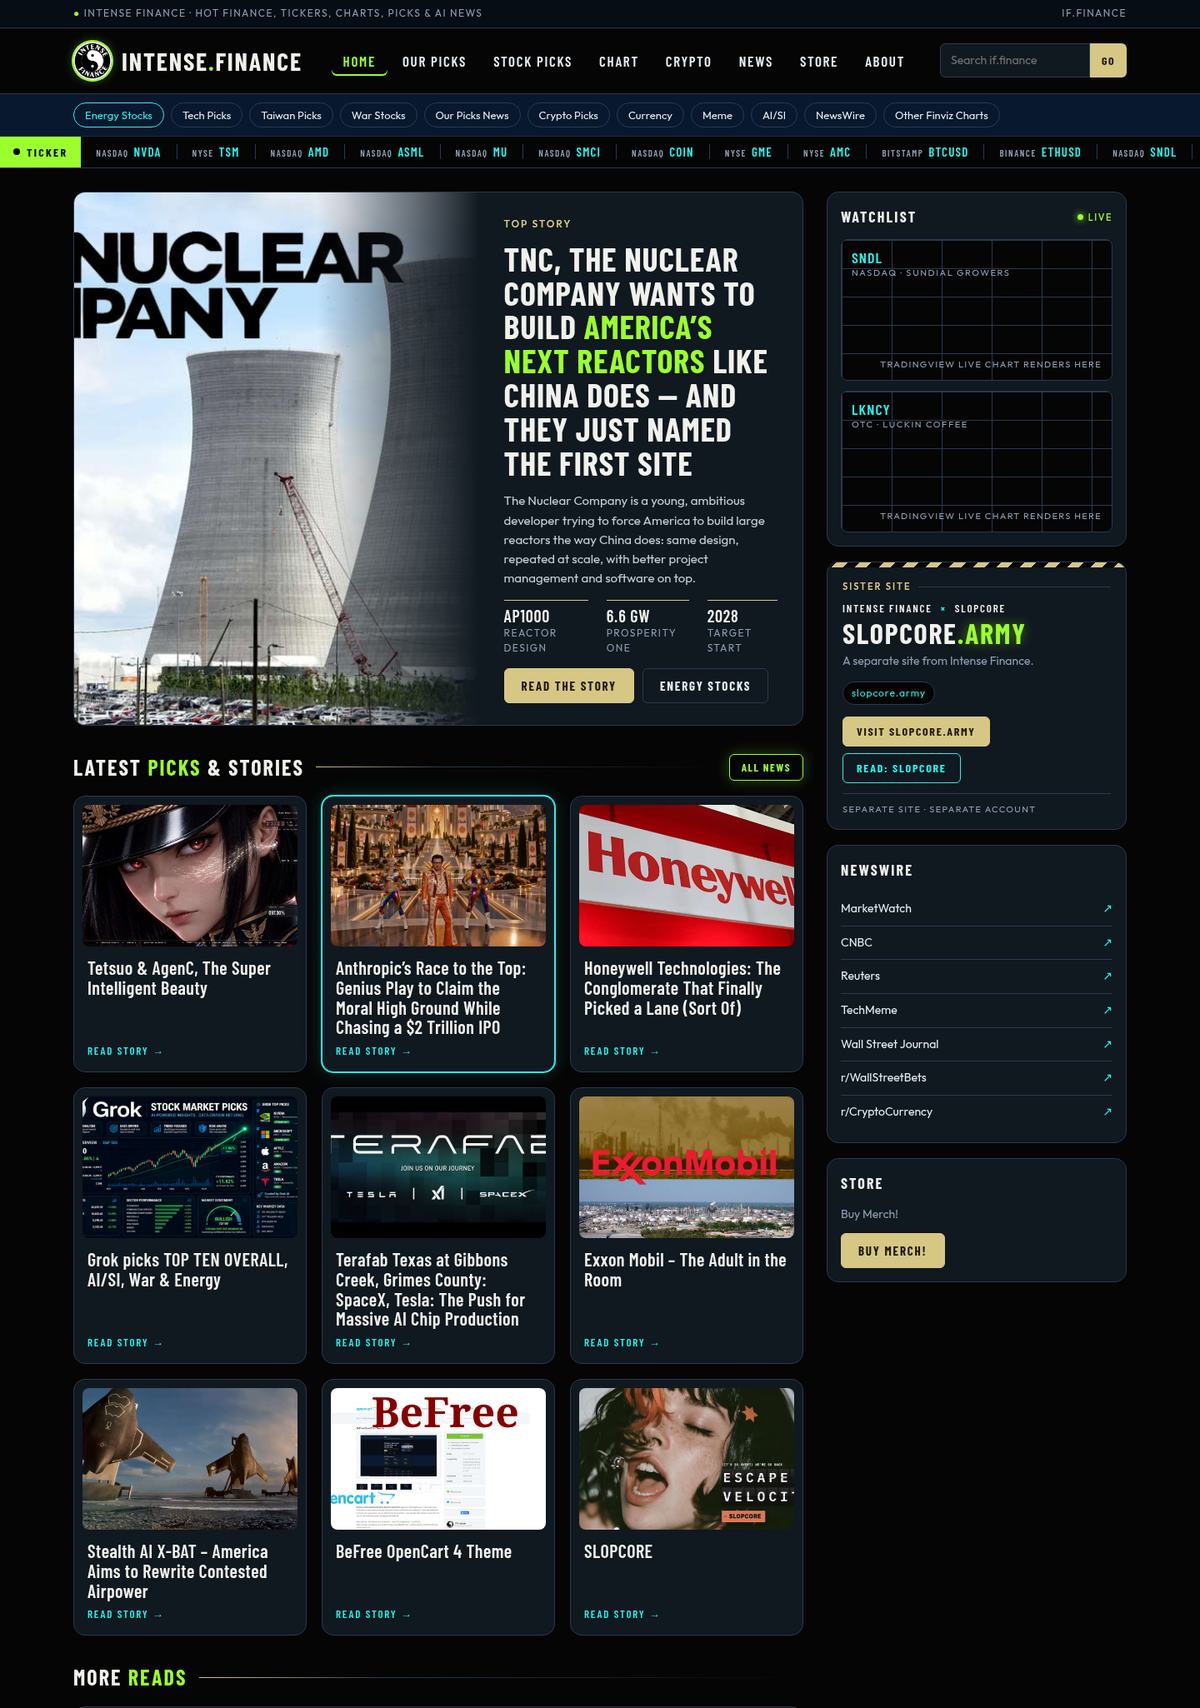
The new look on if.finance is now a theme anyone can use: BeFree Gantry. It is a free, GPLv3 theme for WordPress built on the Gantry 5 framework, and version 1.0.0 is out now on GitHub.

It blends two of our designs into one: the dark industrial BeFree look from our OpenCart theme (navy, gold, Barlow Condensed, chamfered cards) and the if.finance neon palette (lime for anything “live”, cyan for links). That mix is the look you see on if.finance right now.

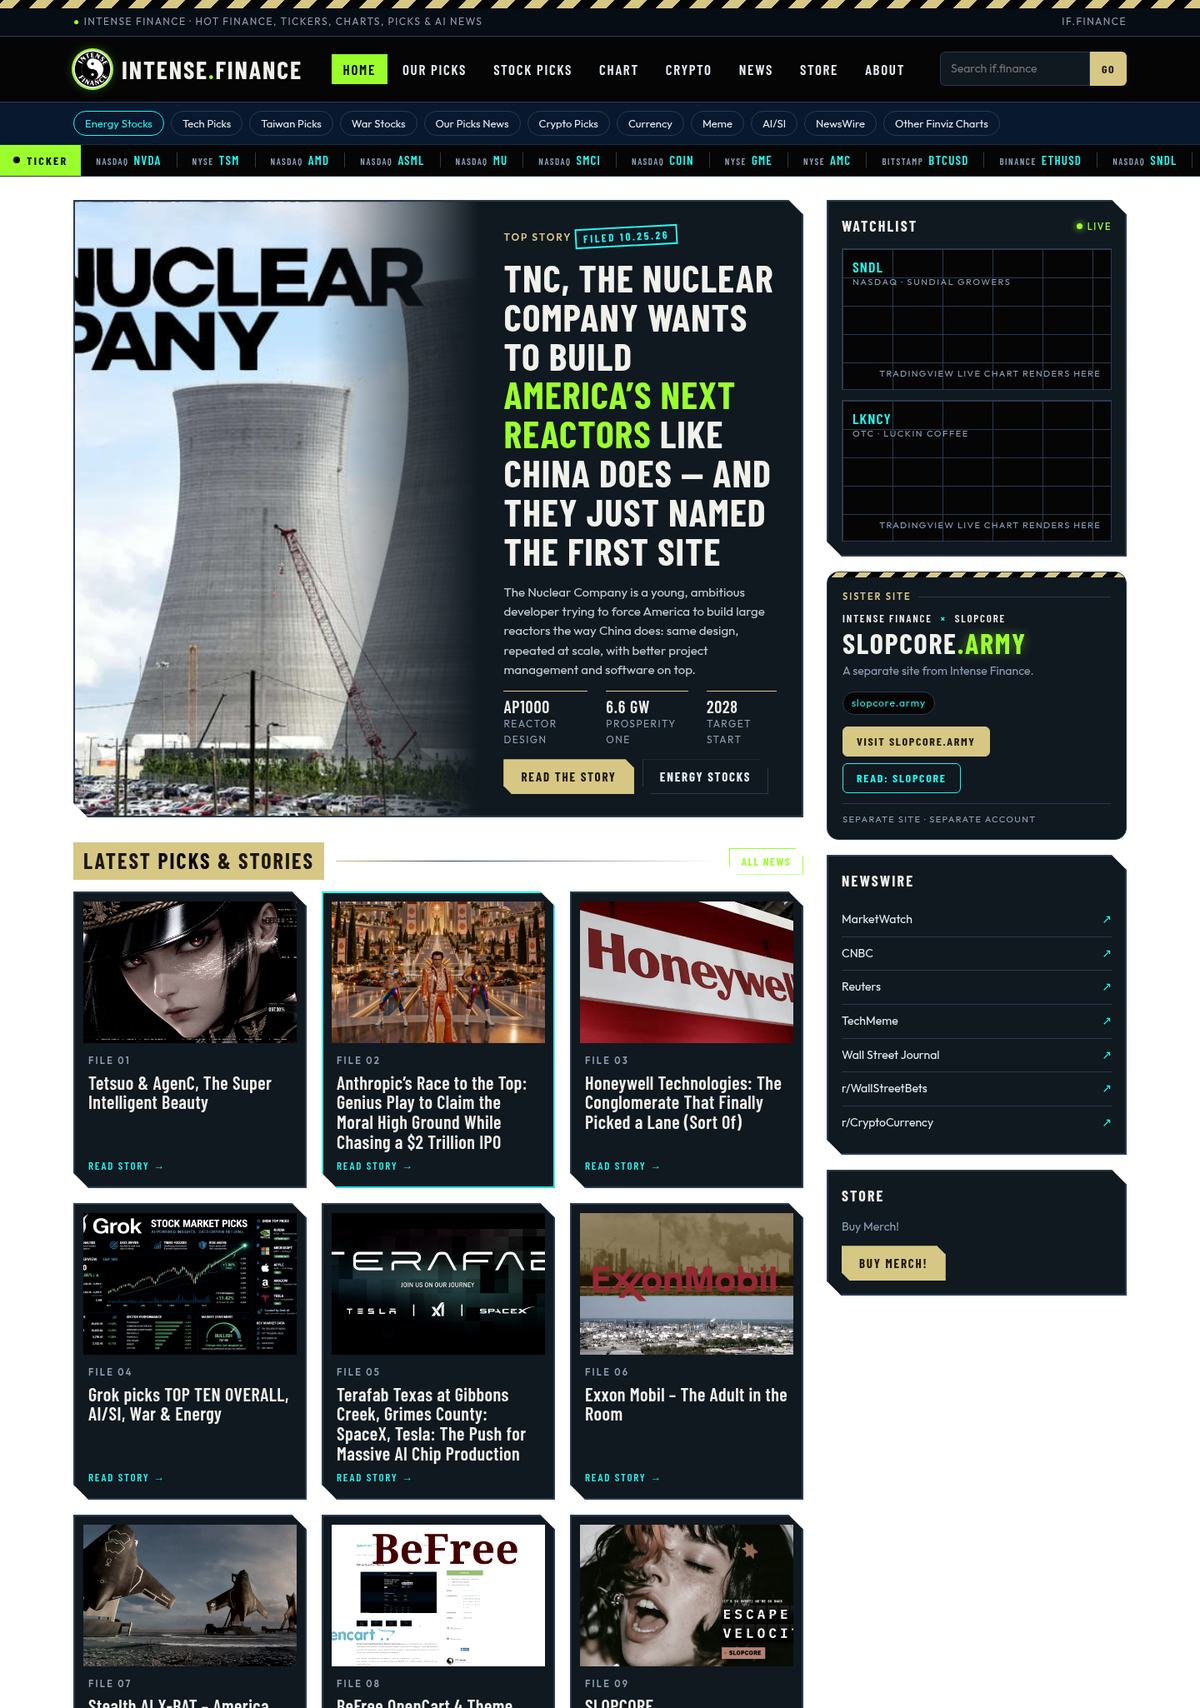
BeFree Gantry Meld Neon style on a finance news home page: navy navigation bar, lime ticker strip, a large top-story card, a grid of dark story cards and a sidebar with a Watchlist and a Sister Site block
Meld Neon, the default style: dark cards, a navy nav bar, lime “live” accents and cyan links.

What you get

  • 6 style presets, every one checked for WCAG AA text contrast.
  • 7 layout presets, from a classic right sidebar to a magazine-style home page.
  • A Sister Site block that links two websites together while they stay separate.
  • Chart-safe styling that leaves TradingView and other chart embeds alone.
  • Local fonts: Barlow Condensed for headings and Outfit for body text, both under the SIL Open Font License. No requests to Google.
  • No phoning home: no tracking and no update server. Updates are a simple zip upload.
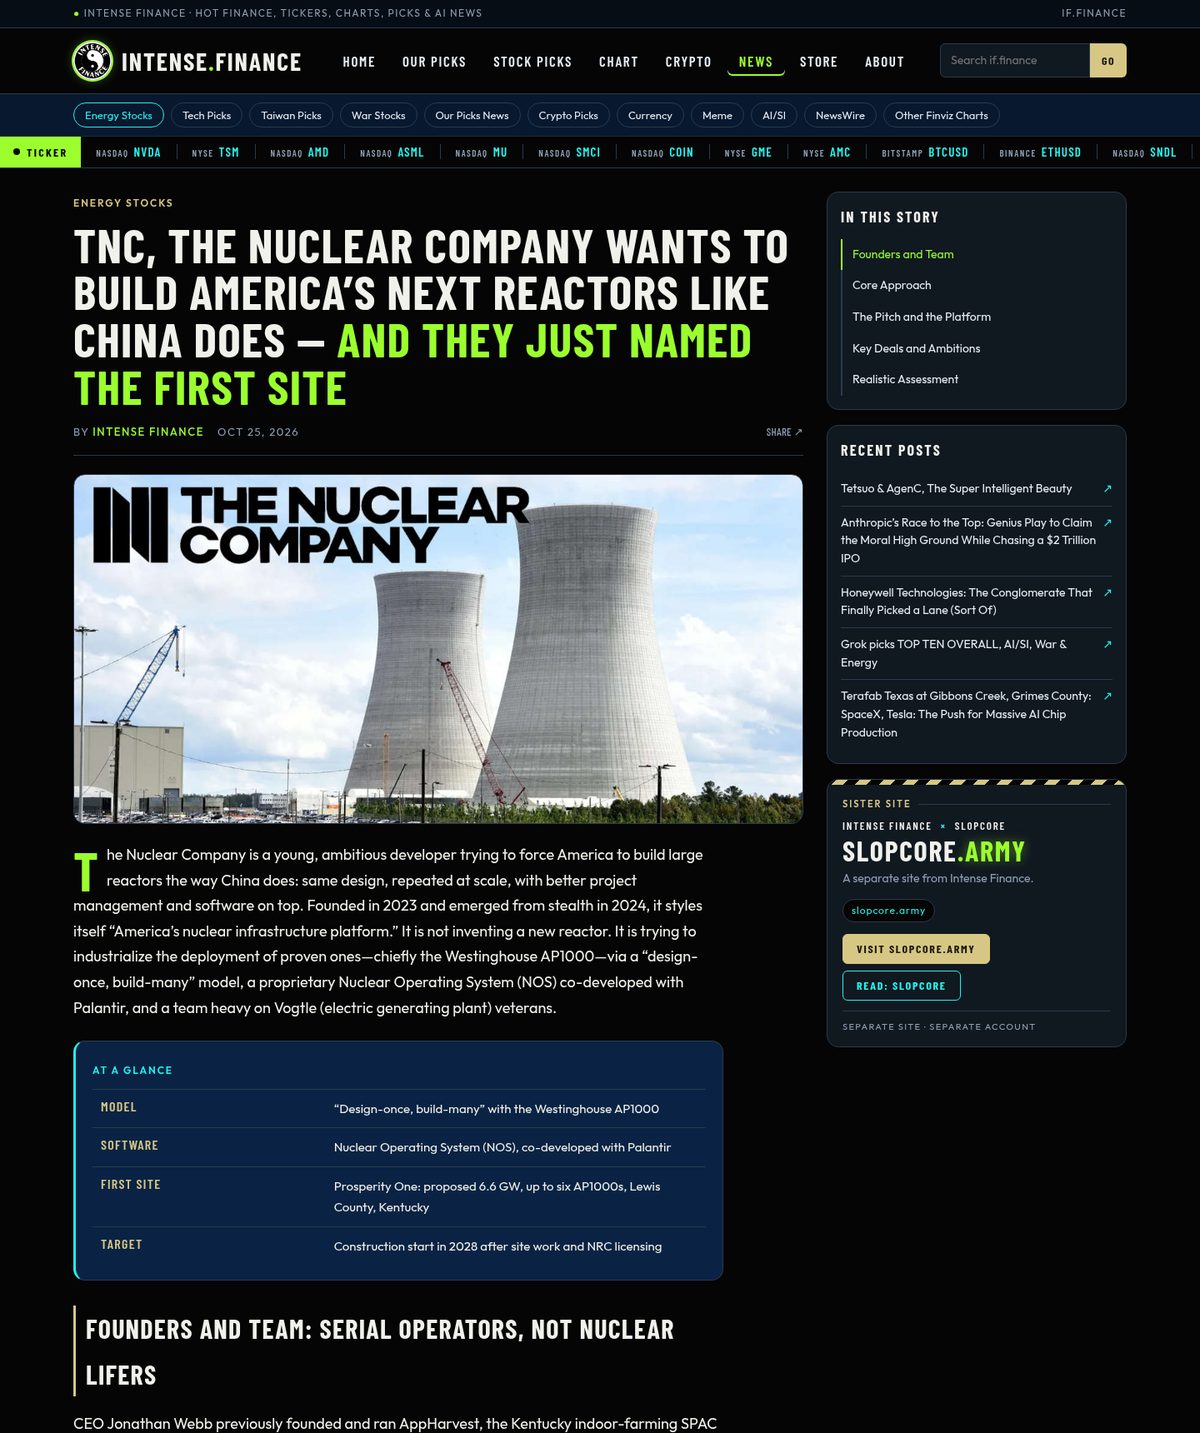
BeFree Gantry article page in the Meld Neon style, with a large condensed headline, a featured image, body text on a dark background and a sidebar
An article page in Meld Neon.
BeFree Gantry Industrial style home page with gold and black hazard stripes, a blueprint grid background, square-cornered cards and gold title plates
The same home page in the Industrial style.

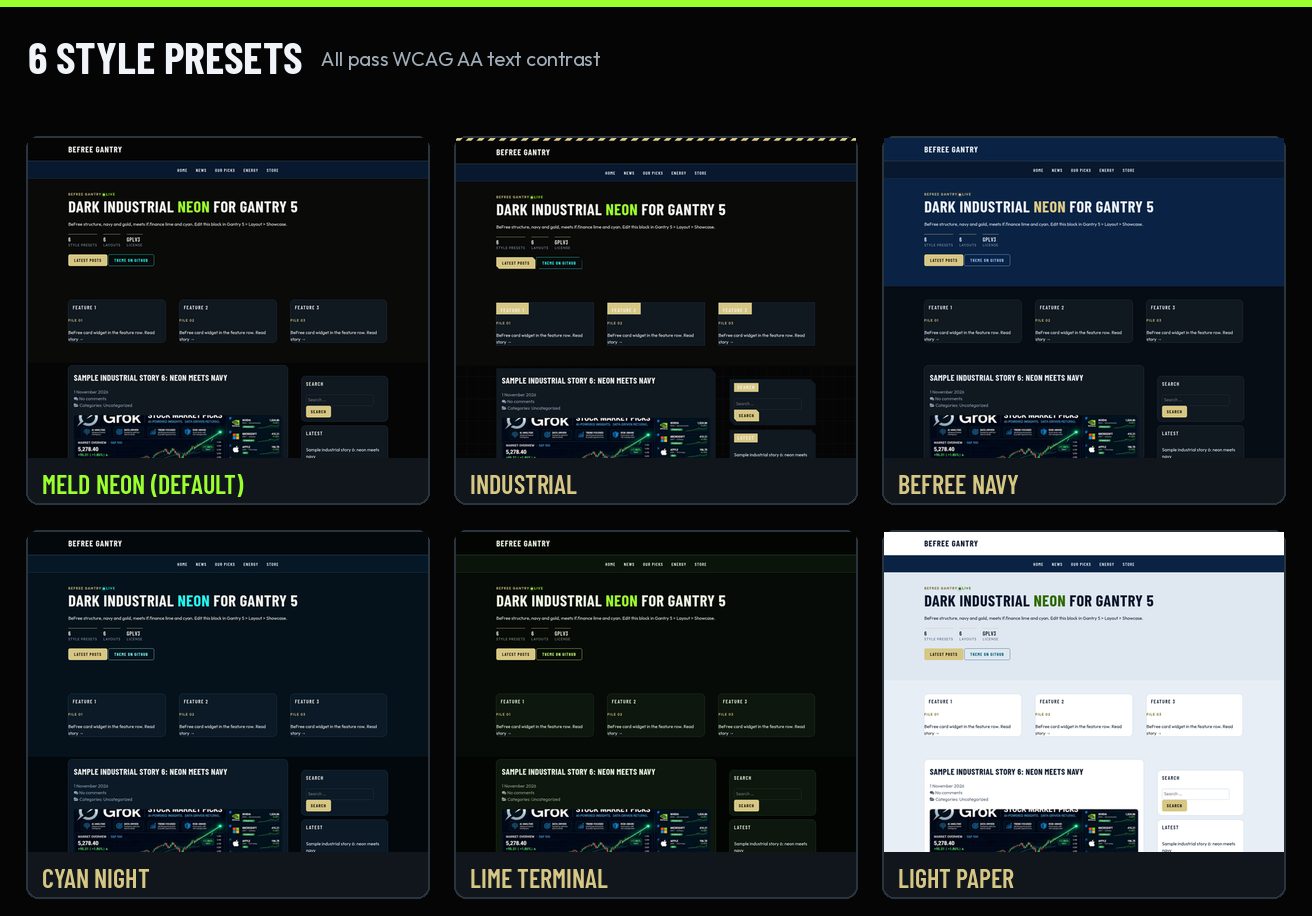
Six styles, one click

Pick a style in Gantry 5 > Styles > Presets. Each one fills a new BeFree Meld settings section, so you can fine-tune gold, card colors, borders and corner radius afterward.

Grid of six BeFree Gantry style preset thumbnails: Meld Neon, Industrial, BeFree Navy, Cyan Night, Lime Terminal and Light Paper
All six style presets on the same test page.
StyleThe lookLowest text contrast
Meld Neon (default)if.finance lime and cyan on BeFree dark industrial5.69:1
IndustrialHazard stripes, blueprint grid, chamfered cards, gold title plates, grayscale images5.69:1
BeFree NavyBeFree’s own navy and gold6.69:1
Cyan NightCyan leads, lime as the second accent5.69:1
Lime TerminalLime on near-black, terminal style6.97:1
Light PaperLight pages with a navy nav bar and footer5.57:1
WCAG AA asks for at least 4.5:1. Every style clears it.

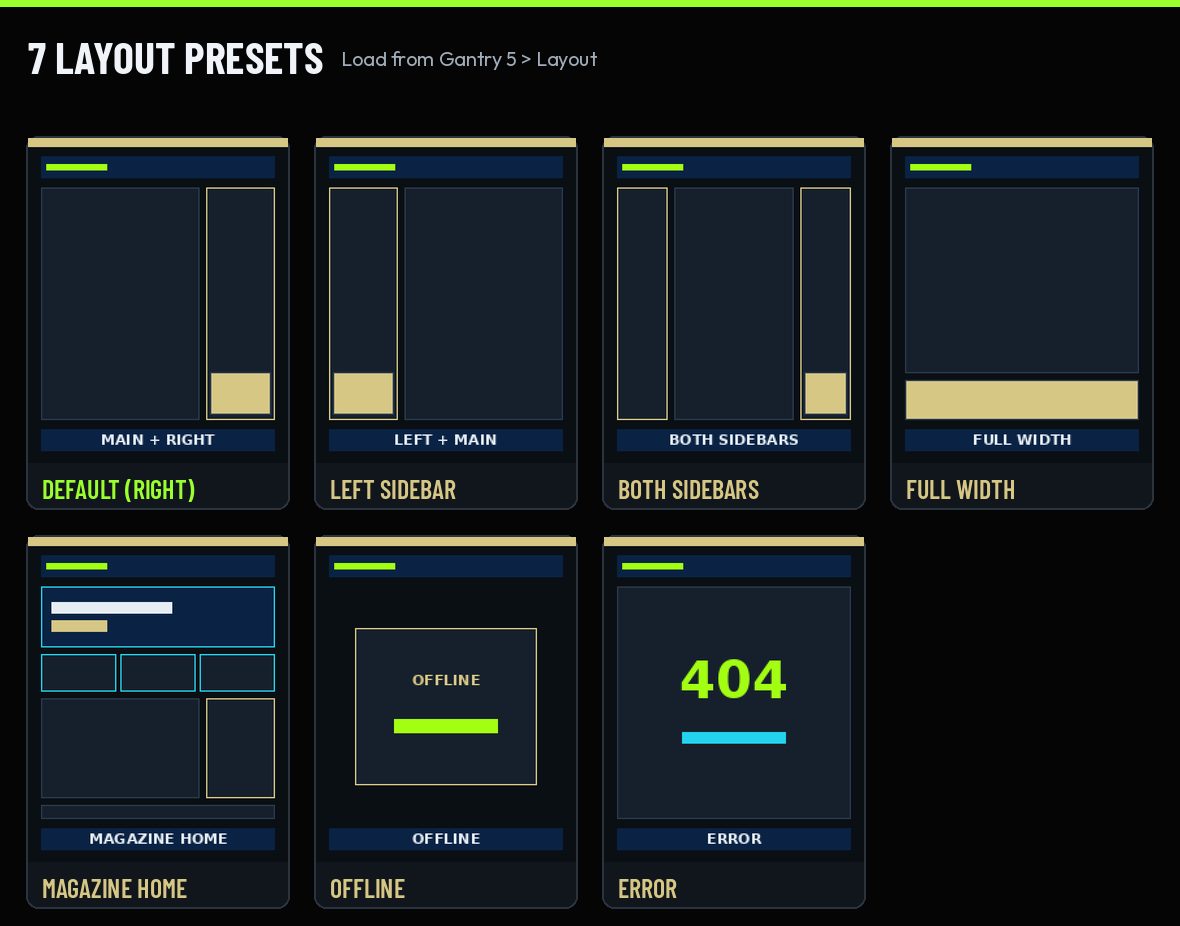
Seven layouts

Load a layout from Gantry 5 > Layout > Load: Default (main with a right sidebar), Left Sidebar, Both Sidebars, Full Width, Magazine Home, Offline and Error. Magazine Home adds a hero row and a three-up feature grid above the posts.

Wireframe thumbnails of the seven BeFree Gantry layouts: Default right sidebar, Left Sidebar, Both Sidebars, Full Width, Magazine Home, Offline and Error
The seven layout presets.

Two sites, one spirit

The Sister Site block ties two websites together without merging them. It ships pointing at if.finance and slopcore.army, and every label, link and button can be changed in its settings. Links are plain links, with no tracking, scripts or redirects. A version of it is live in the if.finance home sidebar.

Two Sister Site blocks side by side: one on if.finance linking to slopcore.army, and one on slopcore.army linking back to if.finance, each with a gold hazard stripe and gold and cyan buttons
The Sister Site block on each side of the pair.

Your charts stay put

if.finance runs a lot of live stock and crypto charts, so this was a hard rule. BeFree Gantry never restyles TradingView or other chart embeds. The only rule that touches them recolors the small TradingView credit link. Custom HTML and Block widgets, where charts usually live, get no extra padding, clipping or cut corners, so charts keep the size they were embedded at.

Chart embeds are left as they are.

BeFree Gantry README

Install it in four steps

  1. Install and activate the free Gantry 5 Framework plugin (Plugins > Add New, search “Gantry 5”). The theme needs it, the same as Hydrogen does.
  2. Download befree-gantry-1.0.0.zip (about 1 MB) from the v1.0.0 release.
  3. Go to Appearance > Themes > Add New > Upload Theme, choose the zip, then click Install Now and Activate.
  4. Open Gantry 5 > BeFree Gantry and pick your style, layout and blocks.

To check your download, compare its SHA-256 checksum with this one (also attached to the release):

30d73912857b654b49495409715ef29c8372188ad295ff1b2a3fa8d286ad448b  befree-gantry-1.0.0.zip

Quick facts

Version1.0.0
LicenseGNU GPL v3 or later. Free to use, change and share.
RequiresWordPress 6.0+, PHP 7.4+, Gantry 5 Framework plugin 5.6.x
Based onGantry 5 Hydrogen by Tiger12, LLC (originally RocketTheme, LLC), GPL v2 or later
FontsBarlow Condensed and Outfit, SIL Open Font License 1.1, bundled locally
Downloadbefree-gantry-1.0.0.zip, about 1 MB
Sourcegithub.com/Intense-Finance/BeFree-Gantry

The BeFree family

BeFree Gantry is the WordPress sibling of BeFree for OpenCart 4 (source on GitHub), the store theme behind pro1intl.store and slopcore.army. Same design language, two platforms, both GPLv3.

Credits and license

BeFree Gantry is a modified version of the Gantry 5 Hydrogen theme, Copyright (C) 2007 – 2022 Tiger12, LLC (originally created by RocketTheme, LLC), GNU GPL v2 or later. The Gantry 5 Framework is a separate plugin by Tiger12, LLC / RocketTheme, LLC and is not bundled. Barlow Condensed is Copyright 2017 The Barlow Project Authors and Outfit is Copyright 2021 The Outfit Project Authors, both under the SIL Open Font License 1.1. No paid or “Pro” RocketTheme code is used. BeFree Gantry is Copyright (C) 2026 Intense Finance, released under the GNU General Public License version 3 or (at your option) any later version.

Read More

Okta Joins the S&P 500: What the Kenvue Swap Means for Investors

Okta (OKTA) will join the S&P 500 before the opening bell on Wednesday, November 4, replacing Kenvue (KVUE) as Kimberly-Clark (KMB) closes its roughly $48.7 billion takeover of the consumer-health company. The identity-security company arrives after a 140% run this year, so index buying may matter less than whether its AI-agent story keeps delivering.

Okta S&P 500 addition: the Nasdaq MarketSite tower in Times Square, New York, where Okta shares are listed
The Nasdaq MarketSite in Times Square. Okta trades on the Nasdaq. Photo: ajay_suresh via Wikimedia Commons, CC BY 2.0 (cropped).

The Okta S&P 500 swap, in one paragraph

The news came over the wire on Friday evening. S&P Dow Jones Indices said in a press release on PR Newswire that Okta, now in the S&P MidCap 400, will replace Kenvue in the S&P 500 effective before trading opens on November 4. The reshuffle cascades down the size ladder: Glaukos (GKOS) moves up from the S&P SmallCap 600 to take Okta’s mid-cap seat, and McGrath RentCorp (MGRC) takes Glaukos’s small-cap spot. In a separate swap, Loar Holdings (LOAR) replaces LiveRamp (RAMP) in the SmallCap 600 because Publicis is buying LiveRamp. [1]

Okta joins the large-cap benchmark as an Information Technology stock. Kenvue leaves from Consumer Staples. [1]

Why Kenvue is leaving

Kenvue isn’t being kicked out for poor performance. It is disappearing. Kimberly-Clark agreed in November 2025 to buy it for $3.50 in cash plus 0.14625 Kimberly-Clark shares for each Kenvue share, worth $21.01 a share at signing and an enterprise value of about $48.7 billion. When the deal closes, Kimberly-Clark holders are expected to own about 54% of the combined company and Kenvue holders about 46%. [2]

The final pieces are falling into place. On October 29 Kimberly-Clark closed a $4.9 billion bond sale in five tranches, from 5.10% notes due 2028 to 5.80% notes due 2036, to help fund the cash part of the deal. CFO Nelson Urdaneta called it “another milestone.” [3] Index provider Solactive told clients on Friday that it expects the deal to close on November 2 and Kenvue shares to stop trading that day. Kenvue shareholders approved the deal on January 29. [4] S&P itself only says the deal is “expected to be completed soon, pending final closing conditions.” [1]

For Kenvue holders, there’s little left to do. Their shares become cash plus Kimberly-Clark stock, so index funds that held Kenvue will end up holding more Kimberly-Clark.

Okta’s run into the index

Okta’s ticket into the S&P 500 was written by a huge rebound. The stock closed 2025 at $86.47 and hit a three-year low of $62.66 on April 10, 2026. It closed Friday at $208.24, up about 141% for the year, against an 11% gain for the S&P 500. That gives the company a market value of roughly $36 billion. [5]

Bar chart comparing Okta stock returns with the S&P 500, Nasdaq and XLK tech ETF over one day, three months, year to date and one year through October 30, 2026
Okta’s price return vs. the S&P 500, the Nasdaq and the XLK tech ETF through the October 30, 2026 close. Source: WallStreetNumbers.com. Chart: if.finance.

The fuel has been AI. Okta sells identity and access software, the digital gatekeeper that checks who (or what) is logging into a company’s systems. As businesses start deploying AI agents, each one needs credentials and limits on what it can touch. “Every agent needs a trusted identity,” CEO Todd McKinnon said in August. [6]

The numbers have backed up the pitch. In the quarter ended July 31 (fiscal Q2 2027), Okta reported: [6]

  • Revenue of $805 million, up 11%, with subscription revenue up 12% to $793 million.
  • Remaining performance obligations (RPO), the contracted backlog of future subscription revenue, up 17% to $4.858 billion. The current portion due in the next 12 months (cRPO) rose 14%.
  • GAAP operating income of $107 million, up from $41 million. GAAP means standard accounting, including stock-based pay.
  • Free cash flow of $227 million, or 28% of revenue.
Bar chart of Okta fiscal Q2 2027 vs Q2 2026: revenue, non-GAAP operating income, free cash flow, GAAP net income and GAAP operating income in US dollar millions
Okta’s fiscal Q2 2027 results vs. a year earlier. Source: Okta Q2 FY2027 press release. Chart: if.finance.

The stock jumped nearly 29% the day after that report, part of a wider cybersecurity rally sparked by fears of AI-driven attacks. McKinnon said new products made up nearly a third of bookings. [7] Profits are real, too: GAAP net income was $116 million last quarter, up from $67 million a year earlier. [6]

Does joining the S&P 500 move the stock?

Usually a little, and often before the effective date. Funds that track the S&P 500 have to buy Okta’s shares to match its new weight, which can lift the price in the short run. [8] On Friday the reaction was modest: Okta rose about 2% after hours, clawing back part of a 6% drop in a broad tech sell-off earlier in the day. McGrath gained 2.8% and Loar 3.5% in late trading on their own index moves. [8]

There are good reasons not to expect much more. Okta was already in the MidCap 400, so the funds tracking that index will be selling as S&P 500 funds buy. And the stock is far from cheap after its run: it trades at about 126 times trailing earnings, and the average analyst price target of $223 is only about 7% above Friday’s close. [5]

The bull case: an S&P 500 seat brings a wider, more stable shareholder base. Okta is profitable, generates lots of cash and sits at the center of a real AI security need. Guidance for the full fiscal year calls for revenue of $3.216–$3.226 billion and free cash flow of $910–$930 million. [6]

The bear case: growth is about 10–11%, not hyper-growth, and the company itself guided for “prudent” numbers. [6] Bank of America, which upgraded the stock to neutral in August, warned that management still views AI as immaterial to this fiscal year’s results. [7] A stock that tripled from its April low can fall hard if that AI narrative cools, as Friday’s 6% drop showed. [5][8]

What to watch next

  • November 2: Kimberly-Clark’s expected closing of the Kenvue deal and the halt in Kenvue trading. [4]
  • November 3 close: this is the last session before the change takes effect, so it is when index-tracking trades in OKTA, GKOS, MGRC and LOAR are likely to cluster. [1]
  • November 4: Okta officially joins the S&P 500. Glaukos, McGrath and Loar move indexes the same day. [1]
  • Okta’s fiscal Q3 report: guidance calls for revenue of $813–$817 million and cRPO of $2.590–$2.600 billion. A beat on cRPO would support the AI-agent story. [6]
  • Tech sentiment: Okta fell more than the market on Friday. Watch whether the cyber trade holds up if AI stocks keep wobbling. [5][8]

Follow more names like this on our Technology Picks page, and check live charts on Finviz Charts.

The bottom line: Okta’s S&P 500 entry is a stamp of approval on a company that turned AI anxiety into AI demand, but the index buying is mostly priced in, and the next real test is its fiscal third-quarter report.

This article is for information only and is not investment advice. Figures are from company releases and the reporting cited below as of October 31, 2026.

References

  1. Okta Set to Join S&P 500; Others to Join S&P MidCap 400 and S&P SmallCap 600, S&P Dow Jones Indices (press release via PR Newswire), October 30, 2026.
  2. Kimberly-Clark to Acquire Kenvue, Creating a $32 Billion Global Health and Wellness Leader, Kimberly-Clark and Kenvue joint press release (Exhibit 99.1 to Kimberly-Clark Form 8-K, SEC EDGAR), November 3, 2025.
  3. Kimberly-Clark Corporation Announces Successful Completion of $4.9 Billion Private Offering of Senior Notes, Kimberly-Clark Corporation (press release), October 29, 2026.
  4. Acquisition | KENVUE INC | 4th November 2026, Solactive (index announcement), October 30, 2026.
  5. Okta, Inc. (OKTA) Stock Price History & Chart, WallStreetNumbers.com, data as of the October 30, 2026 close.
  6. Okta Announces Second Quarter Fiscal Year 2027 Financial Results, Okta, Inc. (press release), August 26, 2026.
  7. CrowdStrike posts best day ever, Okta’s stock pops nearly 29% as rising AI threat lifts earnings, CNBC, August 27, 2026.
  8. Okta jumps after-hours following tapped inclusion in the S&P 500, Investing.com, October 30, 2026.

Image credits

Read More